
Etherdamus, the Ethereum technical analyst formerly known as ScienceGuy9489, has recently tweeted his belief that the “real fun” will begin when BTC breaks above $6,150 and Ethereum breaks above $200;
#Bitcoin above $6,150 and $ETH above $200 is where the real fun begins, remember that these will be hard resistances, but would then act as hard supports if price holds.
— Formerly ScienceGuy9489 (@Etherdamus) May 7, 2019
Etheredamus has chosen these specific prices because they are levels of what he calls “hard resistance,” also known as strong resistance. Once the market manages to climb above these levels of hard resistance, they will then switch and begin to act as areas of “hard support” that the market should technically not drop back beneath.
Etheredamus believes that once BTC manages to break above $6,150 and Ethereum above $200, the market will continue to climb higher with these two levels now acting as the new base support levels.
The analyst formerly known as ScienceGuy has been tweeting his expected “liftoff” dates, with the latest being Ethereum predicted to lift off on April 24, 2019. The market did not manage to live up to his expectations, but price action did rise into resistance at $185. If the market can break above this level of resistance, it will be clear to make an attempt at the $200 level.
Let us take a look at the Bitcoin and Ethereum markets and highlight why the $6,150 BTC and $200 ETH levels are important.
Bitcoin Analysis
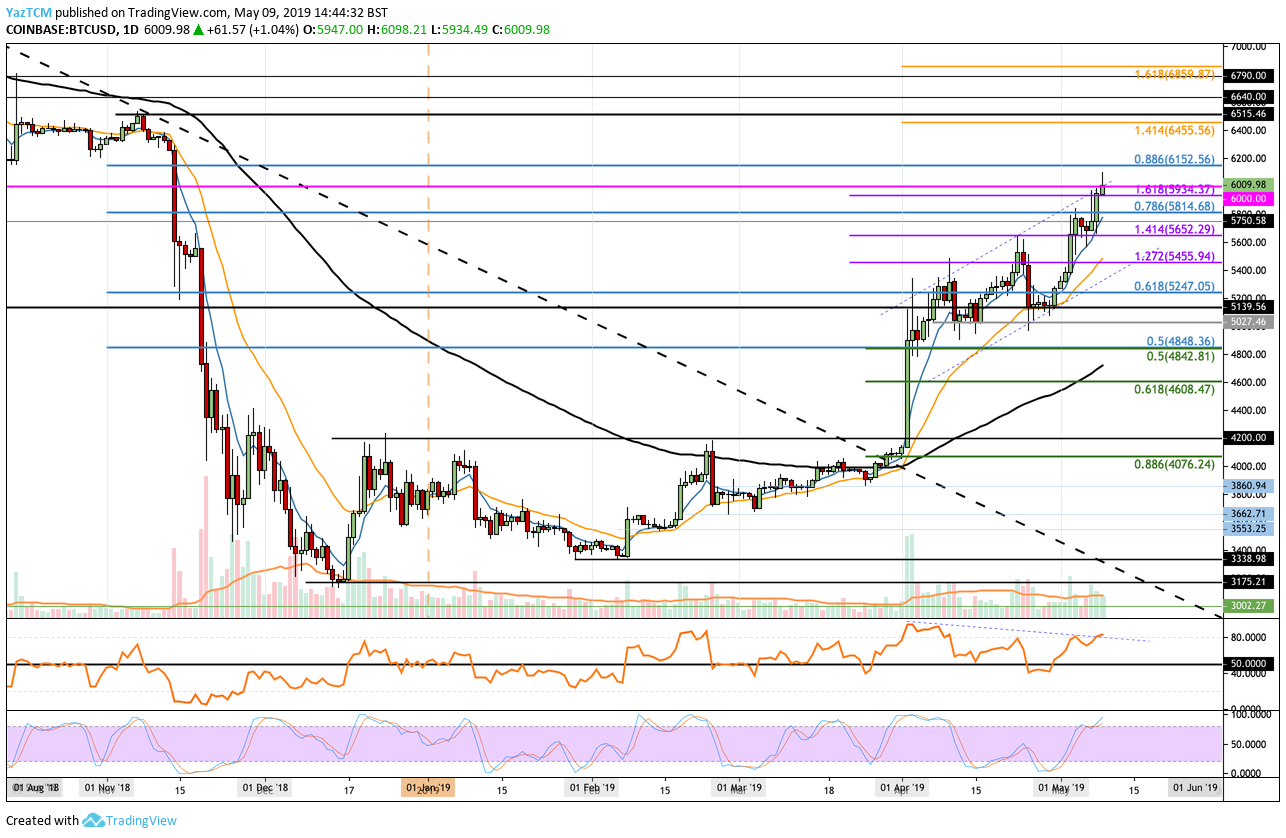
BTC/USD – MEDIUM TERM – DAILY CHART
What Has Been Going On?
Yesterday, May 8, we ran an article on BTC suggesting that the price could be on the way to $6,152. Well, price action seems to be living up to our expectation, as the market broke above the $6,000 level overnight to reach its current trading price at around $6,009. Price managed to reach a high of $6,098 before the market began to drop slightly.
Why Is the $6,150 Level So Important?
Etheredamus had highlighted the $6,150 level as a level of significant resistance. Taking a look at the chart above, we can see that there is a significant level of resistance at $6,150 provided by a long-term bearish .886 Fibonacci Retracement level (drawn in blue). This long-term bearish FIbonacci Retracement level is measured from the November 2018 high, from before the November cryptocurrency wipeout, to the December 2018 low.
Where Can We Go From Here?
If the bullish wave continues further higher, we can expect immediate resistance above the current price to be located at the $6,150 level. If the bulls can break above this, according to Etherdamus, the $6,150 level will then start to act as strong support.
If the buyers continue above $6,150, further resistance above can then be located at the $6,200 and $6,400 levels. Above this, higher resistance can be found at $6,515, $6,640, and $6,790.
What If the Bears Regain Control?
Alternatively, if the sellers regroup and begin to push price action lower, we can expect immediate support beneath $6,000 to be located at $5,934, $5,814, and $5652.
Ethereum Analysis
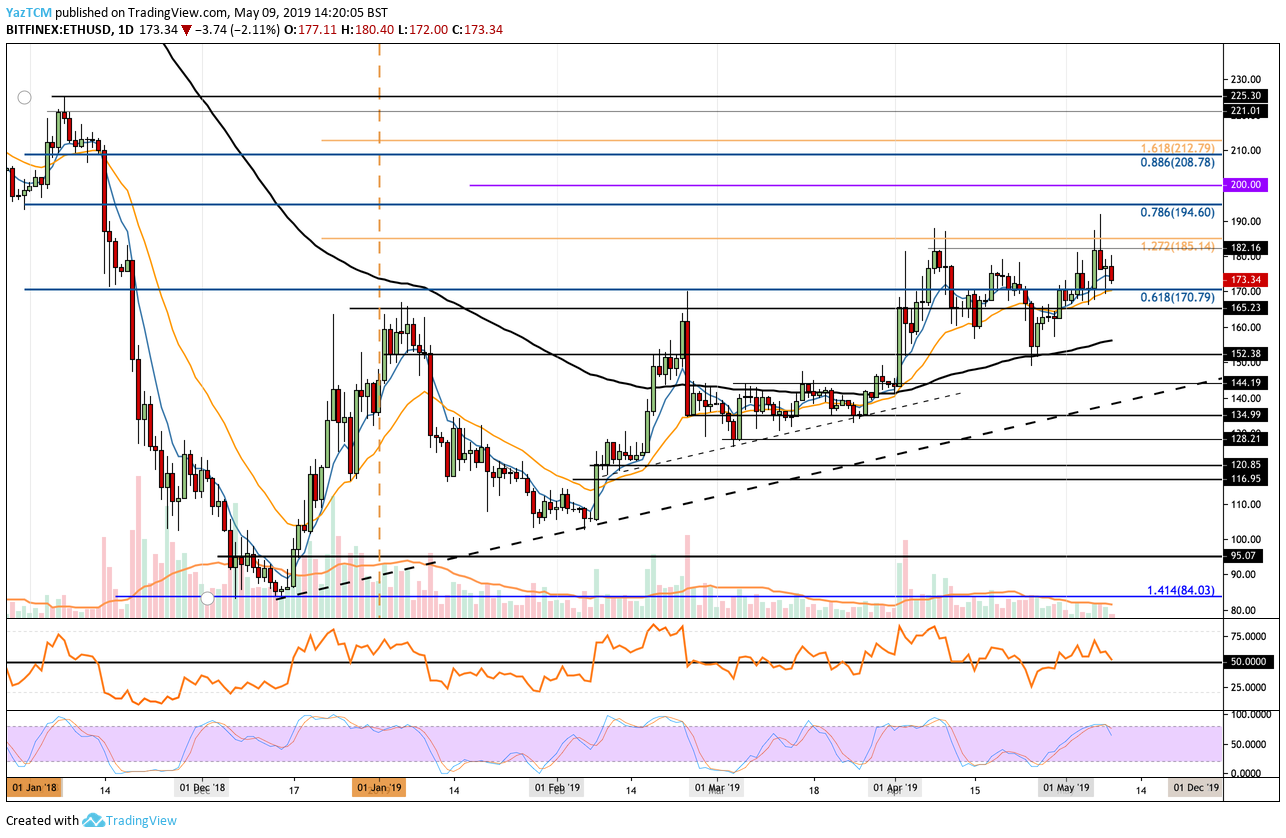
ETH/USD – MEDIUM TERM – DAILY CHART
What Has Been Going On?
Taking a look at the ETH/USD daily chart above, we can see that over the past 2 months the $185 level has provided a significant level of resistance that the market has been unable to overcome. The resistance is provided by a 1.272 Fibonacci Extension level (drawn in orange).
However, Ethereum is still enjoying a strong 90-day period where price action has increased by a total of 56%.
Why Is $200 Important?
The $200 level is an extremely important psychological level for the market to overcome. In traditional markets, round number levels are deemed to be important because this is what traders typically use as a reference to make their trading decisions.
The last important psychological level was at $100. Ethereum broke below $100 for a short period of time during December 2018 to reach a low of $84. However, when Ethereum reapproached the $100 level in February 2019, the market was able to hold at this psychological support.
Where Can We Go From Here?
If the bulls can regroup and begin to bring the market higher once again, we can expect immediate resistance above to be located at $185. If they can successfully climb above this, we can then expect the next level of resistance to be located at the $194.60 level.
The resistance at $194 will be a tricky level to break above because it contains a long-term bearish .786 Fibonacci Retracement level (drawn in blue). This retracement is measured from the November 2018 high to the December 2018 low. If the bulls can continue to break above $194, they will then be free to take a shot at the $200 target.
Above $200, more resistance can be located at $208, which contains the .886 bearish Fibonacci Retracement level (drawn in blue).
What If the Sellers Step In?
Alternatively, if the bulls fail to break above the resistance at $185 and continue to fall further lower, we can expect immediate strong support beneath the market to be located at $170 and $165. Beneath $165, more significant support can be expected around $160, which is further bolstered by the 100-day moving average level.
Conclusion
The recent tweet from Etherdamus may turn out to be very true. If Bitcoin can break above and clear the resistance at $6,150 and Ethereum can break above and clear the $200 region, we may not see these levels again iin the near future.