
At the start of the month, we wrote an article on a prediction made by Reddit user ScienceGuy9489 that Ethereum would take off on April 24. He was so confident that he reiterated the date of the Ethereum explosion on Twitter:
ETH should be breaking out by April 24th pic.twitter.com/z8lwk9zMHY
— ScienceGuy9489 (@ScienceGuy9489) March 11, 2019
It seems that SceinceGuy9489 still predicts that an Ethereum liftoff will occur on April 24, after another recent Reddit post where he presented a new piece of analysis relating to the “Golden Crossover”:
If we continue the upward trend, I estimate the golden cross happening sometime between April 30th and May 5th for #ETH pic.twitter.com/NOPNlG4wqs
— ScienceGuy9489 (@ScienceGuy9489) April 19, 2019
In his analysis, ScienceGuy9489 draws our attention to Ethereum’s “Golden Crossover” attempt. The Golden Crossover is a technical analysis signal that occurs when the 50-day exponential moving average (EMA) crosses up above the 200-day EMA. He expects the Golden Crossover to occur at some point during April 30 and May 5.
ScienceGuy9489 stresses that users should be following EMAs as opposed to the simple moving averages, due to the fact that crypto follows exponential moving average trends. He even went as far as creating another Reddit post to illustrate the difference between exponential moving averages and simple moving averages.
What About the April 24 Prediction?
Although ScienceGuy9489 predicted the Golden Crossover to occur after April 24, the liftoff could still take place on this date. The Golden Crossover is, by most estimates, a lagging indicator. This means that price action will rise significantly before the crossover actually occurs on the chart itself.
ScienceGuy9489 holds firm in his conviction that the liftoff will still occur, as can be seen in his recent Reddit comment:

Although price action experienced a small breakout after Bitcoin’s price surge at the start of April 2019, which saw Ethereum break above the $175 level, there is still a lot of room for Ethereum to travel higher.
According to ScienceGuy9489’s analysis, a break above the $180 resistance level, and above the 200-day moving average, will free Ethereum to test the $200 level and continue further higher.
Let us take a look at some of our own analysis and highlight some areas of support and resistance for ETH/USD moving forward.
Etheruem Analysis
Ethereum has seen a small 1.50% price hike over the past 24 hours of trading, as the market now trades at a price of $173 per coin. Ethereum has seen a further 25% price increase over the past 30 days, which extends to an increase of 44% over the past 90 trading days.
Ethereum is presently ranked in 2nd position, as the 44-month-old cryptocurrency currently holds an $18.17 billion market cap valuation.
What Has Been Going On?
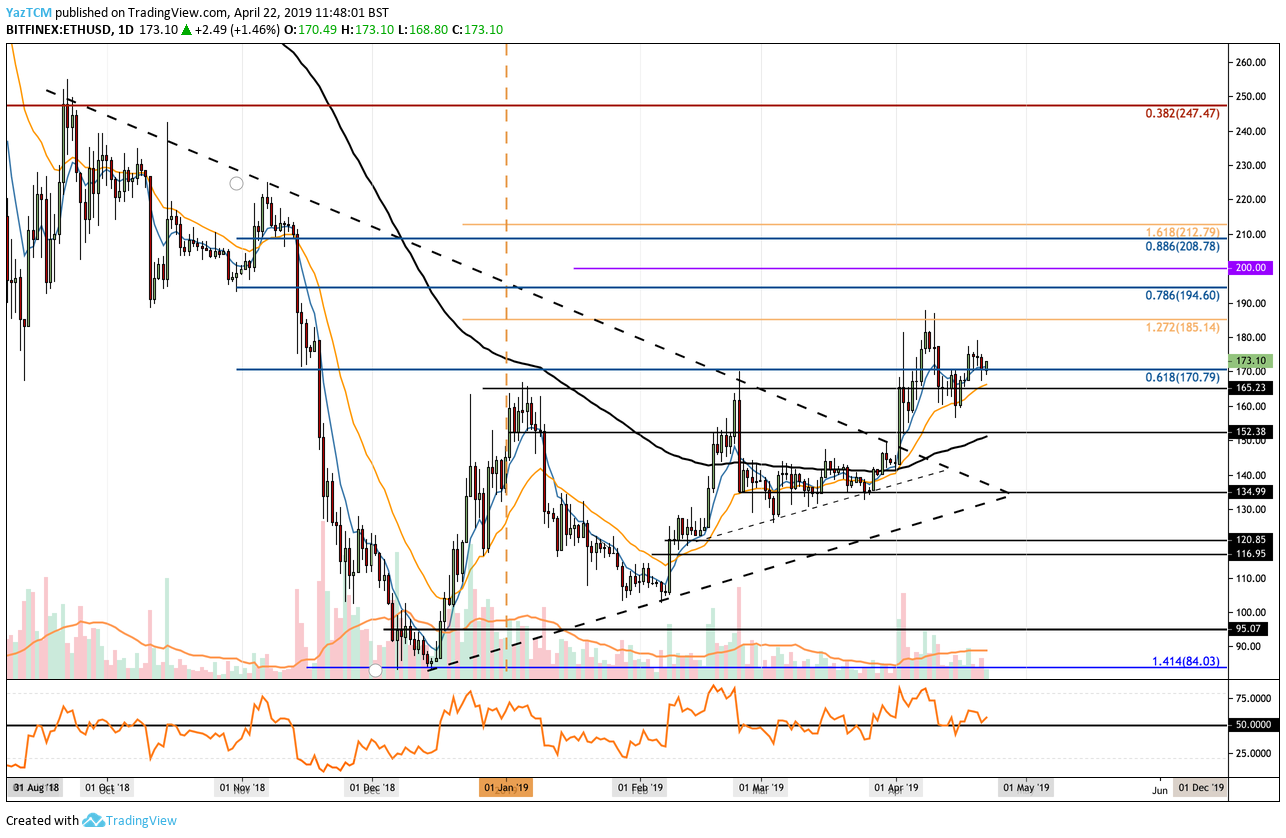
Taking a look at ETH/USD above, we can see that the market broke out of a long-term symmetrical triangle formation at the start of April 2019, when Bitcoin experienced a significant surge higher.
The market managed to continue to climb further higher above resistance at a bearish .618 Fibonacci Retracement level (drawn in blue), priced at $170, and into resistance at a 1.272 Fibonacci Extension level (drawn in yellow), priced at $185, before rolling over.
ETH/USD is now currently trading above the support at $170 as it continues to wait for the next push higher.
Where Can We Go From Here?
If the April 24 prediction is true, we can expect a surge to occur over the next couple of days. If this is the case, we can expect immediate resistance higher to be located at the $185 resistance level. Above this, higher resistance can then be expected at the bearish .786 Fibonacci Retracement level (drawn in blue), priced at $194, before the ETH/USD bulls can take a crack at the $200 level.
If the buyers continue to climb further above the $200 level, we can expect higher resistance to be located at the bearish .886 Fibonacci Retracement level (drawn in blue), priced at $208.
What If the Sellers Regain Control?
Alternatively, if ScienceGuy9489’s prediction fails and Ethereum rolls over again, we can expect immediate support toward the downside to be located at the $165 level. Beneath this, further support can then be located at the $152 level, where lies the 100-day moving average.
What Are the Technical Indicators Showing?
The RSI is battling to remain above the 50 level as the bulls fight for market momentum. If the RSI can remain above 50, we can expect the bullish presence to remain within the market.