
Bitcoin has been on a 3-month price run that totals over 70%, which has allowed the price of the cryptocurrency to climb toward $5,859. The market had been struggling around resistance around $5,814 for the first week of May 2019, but has recently managed to overcome this level.
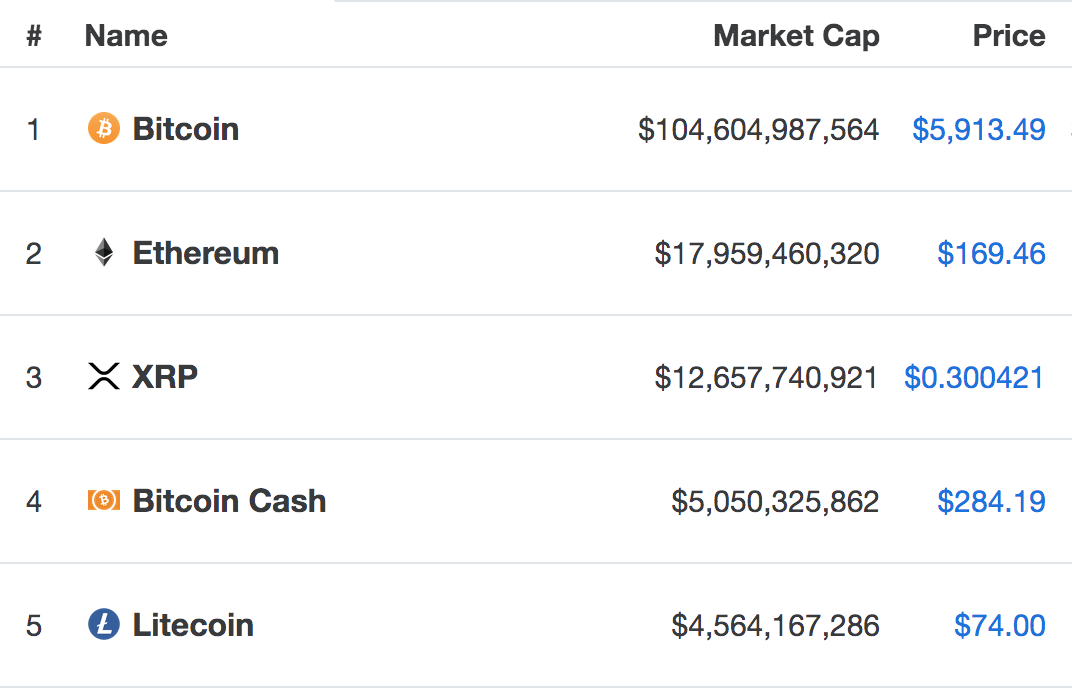
Bitcoin has finally managed to break above the $100 billion market cap valuation once again to rise to its current value at $104 billion.
In this article, we will take a look at Bitcoin’s potential to reach the $6,152 level by the end of the week. $6,152 has been chosen as it is a level of relatively strong resistance, which has been provided by a long term bearish .886 Fibonacci Retracement level that has been measured from the November 2018 high to the December 2018 low.
Bitcoin is in a worrisome position after the recently reported Binance 7,000 Bitcoin hack. The hackers withdrew 7,000 BTC in just one transaction. Interestingly, this exact same hack happened before to Binance Exchange a year ago.
Bitcoin Price Analysis
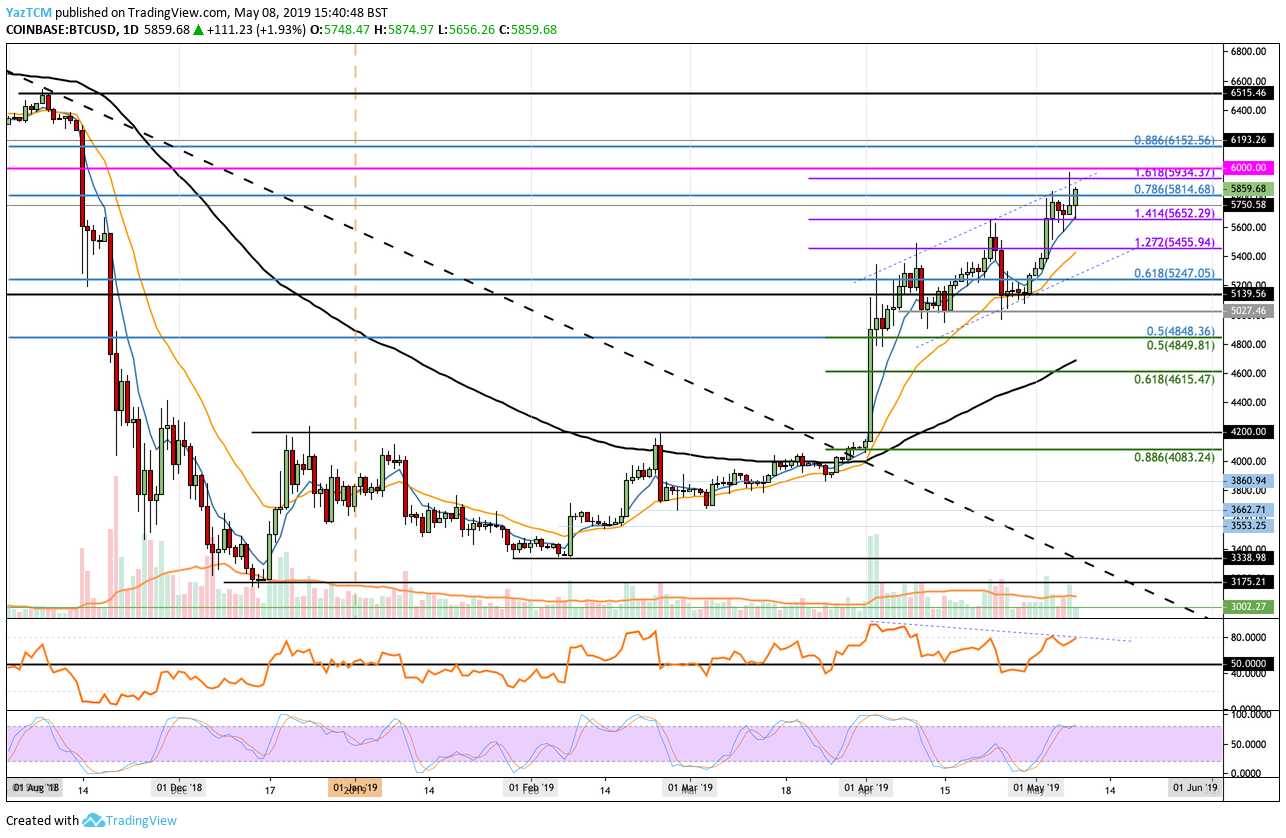
BTC/USD – MEDIUM TERM – DAILY CHART
What Has Been Going On?
Analysing BTC/USD above, we can see that May has, so far, been a decent month for Bitcoin, after the price action managed to increase by a total of 11% since the start of the month. The market has recently managed to climb above the resistance at $5,814, provided by a bearish .786 Fibonacci Retracement level (drawn in blue), and is now trading at $5859.
What Is the Current Short-Term Trend?
At this moment in time, the current short-term trend for BTC/USD is still bullish. But if the sellers step in and push price action below the support at $5,600, the bullish trend will be invalidated.
Where Can We Go From Here?
If the buying continues further higher, we can expect immediate resistance above the market to be located at the 1.618 Fibonacci Extension level (drawn in purple), priced at $5,934 and followed with more resistance at the $6,000 level.
If the bulls continue above $6,000, higher resistance is then located at our target level at $6,152. We can see this level of resistance is provided by the bearish .886 Fibonacci Retracement level (drawn in blue), which is measured from the November 2018 high to the December 2018 low.
Further resistance above $6,152 is located at $6,400, and then the November 2018 high at $6,515.
What If the Bears Regain Control?
Alternatively, if the bears step back in and begin to push the market lower, we can expect immediate support beneath at $5,814, $5,750, $5,652, and $5,455.
If the bears continue beneath $5,455, more support can be located at $5,247, $5,140, and $5,000.
What Are the Technical Indicators Showing?
The RSI remains above the 50 level, which indicates that the bulls have managed to remain in control of the market momentum. However, there is some clear divergence between the RSI and price action. The RSI is making lower lows while price action continues to make higher highs. This is a clear signal of divergence, which suggests that a reversal and a retracement may be on the cards in the following days.
Furthermore, the Stochastic RSI is poised to initiate a crossover signal in overbought territory, which adds further to the suggestion that a reversal is potentially on the table.
Conclusion
If Binance exchange can quickly settle the uneasy sentiment related to their recent hack, we can expect the bullish run to continue for Bitcoin. If this is the case, we can expect Bitcoin to break above $6,000 by the end of the week and hit $6,152. However, there are signals from the RSI that suggest a reversal is potentially on the cards before the break above $6,000.