
Decred has suffered a turbulent month after 2 months of strong rising prices, dropping a total of 17.76% over the past 30 trading days, at the time of writing. The cryptocurrency currently is trading around $73, dropping back below the $100 mark earlier this month.
Created in 2016, Decred is intended to be an open and progressive cryptocurrency with the capability for a community-based governance that is integrated with the blockchain. Token holders can lock up their tokens in a stake in order to receive a ticket to vote on upcoming network proposals allowing them to have a say in the project. For more in-depth information on what Decred is and its unique outlook on its governance model, please refer to our Decred project overview.
The PoW/PoS hybrid cryptocurrency is currently ranked 25th in terms of overall market cap across the entire industry with a market cap of $537 million. This is down by a significant sum of $145 million from the market cap high seen last week at $682 million. However, it is important to note that the entire cryptocurrency market has continued to take a beating over the past 7 days as the entire market cap has dropped over $30 billion throughout the last 7 trading days.
Although the markets may be trading in a bearish direction for Decred, the future still looks promising as exchanges continue to support Decred by adding the USD-Tether market. With the prospects of a possible Decentralised EXchange (DEX) running via atomic swaps it is hard not to get excited. Read “Why you should keep an eye on Decred” to find out more about recent developments by the project.
Let us analyze price action over the long and recent term.
Price Analysis
DCR/USD – LONG TERM – DAILY CHART
https://www.tradingview.com/x/M7p519Ug/
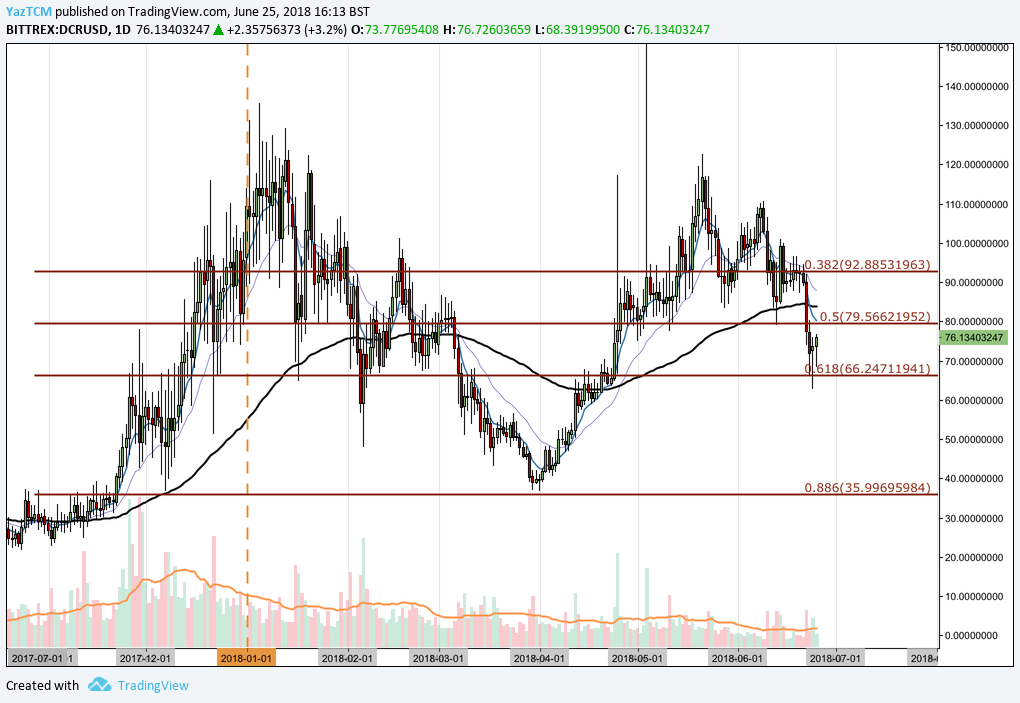
Looking at the long-term chart above for Decred against the USD, we can see that price action had experienced a steep bullish run during from November 2017 until January 2018, rising from a low of $22.79 on November 2, 2017 to a high of $135.67 on January 5. This was an incredible 475% increase in price over a period of around 64 days.
Since placing this high, price action continued to depreciate against the USD, falling to a yearly low of $36.81 placed on April 1, 2018. This level also corresponds with the .886 Fibonacci Retracement at a price of $35.99, this is a Fibonacci Retracement taken from the entire bullish run seen from November 2017 to January 2018.
During April and May, price action continue to rally, momentarily spiking above $160 for one hour during early May, reaching a high of $120 (ignoring the momentary spike).
However, price action began to roll over once again as June came around. The past week of trading sessions have been rocky for Decred as price action falls sharply only to find strong support at the .618 Fibonacci Retracement at a price of $66.24.
If price action can hold above the .618 Fibonacci Retracement, this could serve as a good platform to make another bullish rally to allow the market to retest $100 once again.
Alternatively, if the bears stranglehold on the market continues to grow, we could expect price action to to fall back below the .618 Fibonacci Retracement. In this scenario, the nearest level of long term support is located at the .886 Fibonacci Retracement and the yearly lows located between $35.99 and $36.81.
Let us analyze price action over the more recent months a little closer.
DCR/USD – SHORT TERM – DAILY CHARTS
https://www.tradingview.com/x/LyZQXclX/
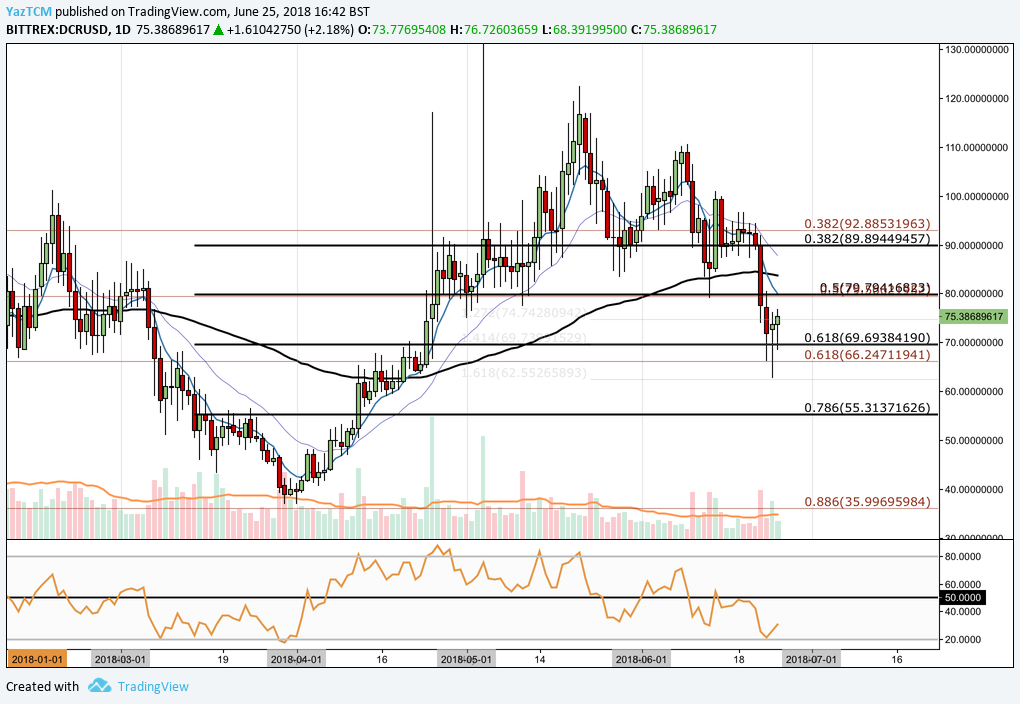
Analyzing price action over the more recent term, we can see that the market has fallen up to the short term .618 Fibonacci Retracement at a price of $69.69 where it was met with strong resistance. This is a Fibonacci Retracement, marked in black on the charts, of the bullish run seen during April and May.
We can also see that the low seen during trading action on June 24 was $62.55, which is the 1.618 Fibonacci Extension taken from the initial bearish leg seen during toward the end of May. This Fibonacci Extension level should provide support in the future if prices continue to fall.
If price action can continue with this market rebound and push price above the $80 handle, then we could expect the bulls to continue with this bullish pressure until they meet near term resistance at the short term .382 Fibonacci Retracement (marked in black) at a price of $89.89.
Alternatively, if recent bearish pressure begins to rebuild once again and prices dip below the .618 Fibonacci Retracement at $69.69, then we could expect bearish action to push prices toward near term support at the 1.616 Fibonacci Extension priced at $62.55. Further support located below this is at the .786 Fibonacci Retracement at a price of $55.31, followed by the long term .886 Fibonacci Retracement and April’s low around $36.
The technical indicators are largely favoring the bears in this scenario at this current moment in time. The RSI is trading well below the 50 handle making its way up out of oversold conditions. If the RSI can approach and break above the 50 handle, this would indicate that the bearish momentum within the market is fading and that the bears are beginning to step in.
To add further to this, price action is trading well below the 100 day moving average (black line) as well as the 7-day EMA (blue line). We would like to see the 7-day EMA pointing in a bullish direction and for it to start to converge toward the 21-day EMA (purple line), this would signal that the bears are losing steam within the market. A cross of the 7-day EMA above the 21-day EMA would indicate that the bulls have recently started to gain some strong momentum within the market.
Let us analyze how Decred has been trading against BTC in the recent term.
DCR/BTC – SHORT TERM – DAILY CHART
https://www.tradingview.com/x/3smVl7RW/
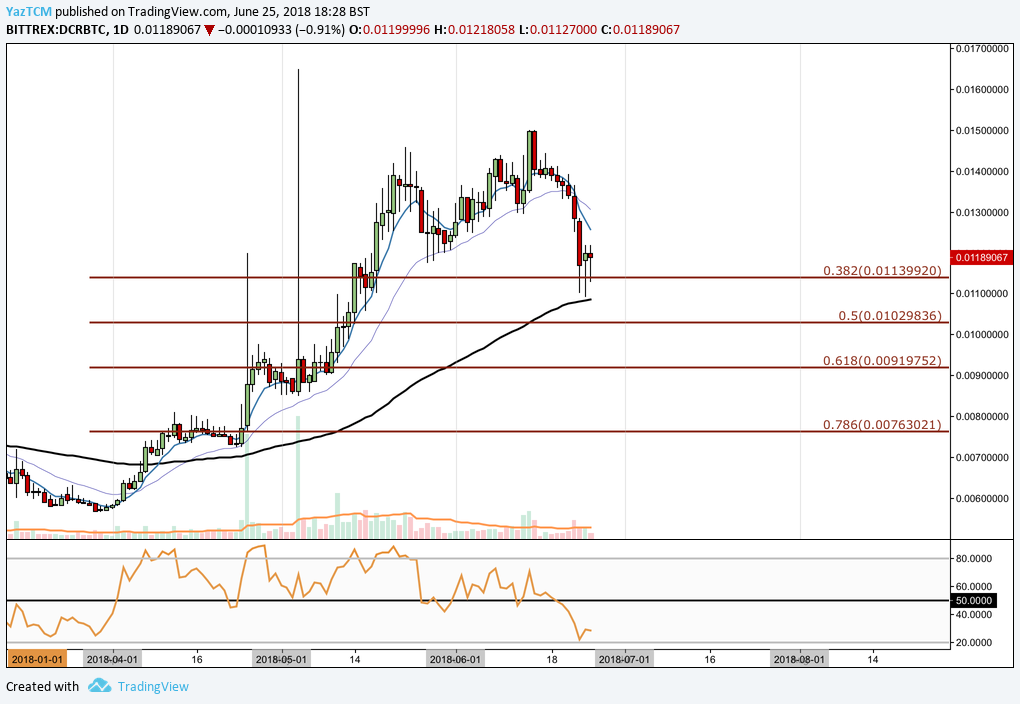
Looking at Decred against Bitcoin, we can see that Decred had also experienced a bullish run during April, May and early June as price action rose from a low of 573K SATS on April 1 to a high of 1.5M SATS on June 14. This was an increase of over 160% in price from low to high.
Since placing this high earlier this month, Decred has depreciated and fallen toward the .382 Fibonacci Retracement at a price of 1.139M SATS, where the market found significant support before rebounding. This is a Fibonacci Retracement taken from the entire bullish run seen during April, May and June.
If price action continues on its bearish trajectory and breaks below the .382 Fibonacci Retracement level, then the nearest level of support is located at the .50 Fibonacci Retracement at a price of 1.02M SATS. If price action continues lower then further support can be found at the .618 Fibonacci Retracement priced at 919K SATS.
Alternatively, if the market finds significant support from this rebound above the .382 Fibonacci Retracement then the bulls will be free to, once again, push prices higher until it meets resistance as it retests June’s all time high at 1.5M SATS.
Conclusion
Like most cryptocurrencies in the top 100, Decred has suffered a turbulent month in June. However, it is important to remember that price action has found support at significant long term support levels which may indicate that Decred may have potentially found support before creating a new all time high.
We will be closely watching price action over the next week of trading sessions to see in which direction the market wants to direct us next.
Related: Price Analysis: Sia Trading Within a Very Tight Range Against Bitcoin