
Siacoin, the decentralised cloud storage platform, has experienced a rough couple of months, however, sentiment may be starting to look bullish as crypto exchange giant, Binance, lists Siacoin.
Siacoin has lost up to 25% in value over the past 7 trading days and up to 29% over the past the 30 trading days.
It is important to note that this sharp drop in value is apparent across the entire board of cryptocurrencies as markets wipe out over $70 billion in total market cap across all assets. Coins such as VeChain, NEO, IOTA and STEEM have all posted losses of up to 25% over the past 7 days. Meanwhile, Golem has posted losses of up to 30% and Skycoin has experienced a loss of 40% over the past 7 trading days.
However, the near term future may be looking even more promising for Sia holders as Binance recently announced the addition of Siacoin to their exchange. Price action had spiked up by 40% upon hearing the news before, shortly correcting afterward.
Siacoin was launched on June 6, 2015 and was created to become an alternative to commercial cloud storage solutions available today. The Siacoin team set out to create a data storage marketplace upon the blockchain that would allow users access to cheaper and faster storage that cloud storage giants such as Amazon, Google and DropBox.
The Sia network works by allowing users to rent out spare hard drive space on other user’s computers for a fee that would be paid in Siacoin. The storage sequence would occur firstly by breaking apart files that users would like to upload, then the network will encrypt the individual fragmented files and distribute them across the hard drives on the entire network. Thus creating a reliable, safe and secure form of cloud storage that was not prone to a centralized hack.
If a user would then like to reclaim his stored files, he would have the private keys to his own files allowing him to be able to download all of the individual fragments and then decrypt them all to receive his file.
Siacoin has been dubbed as the AirBnB of cloud storage and is strongly living up to its name. The Sia network currently has a total capacity of 5.5 Petabytes of cloud storage space and users of the Sia network have currently stored 193 Terabytes of data upon the network.
For a more in-depth read on Siacoin, check out “What is Siacoin,” and our review of the Siacoin roadmap.
Let us take a look into price action of Siacoin over the long term.
PRICE ANALYSIS
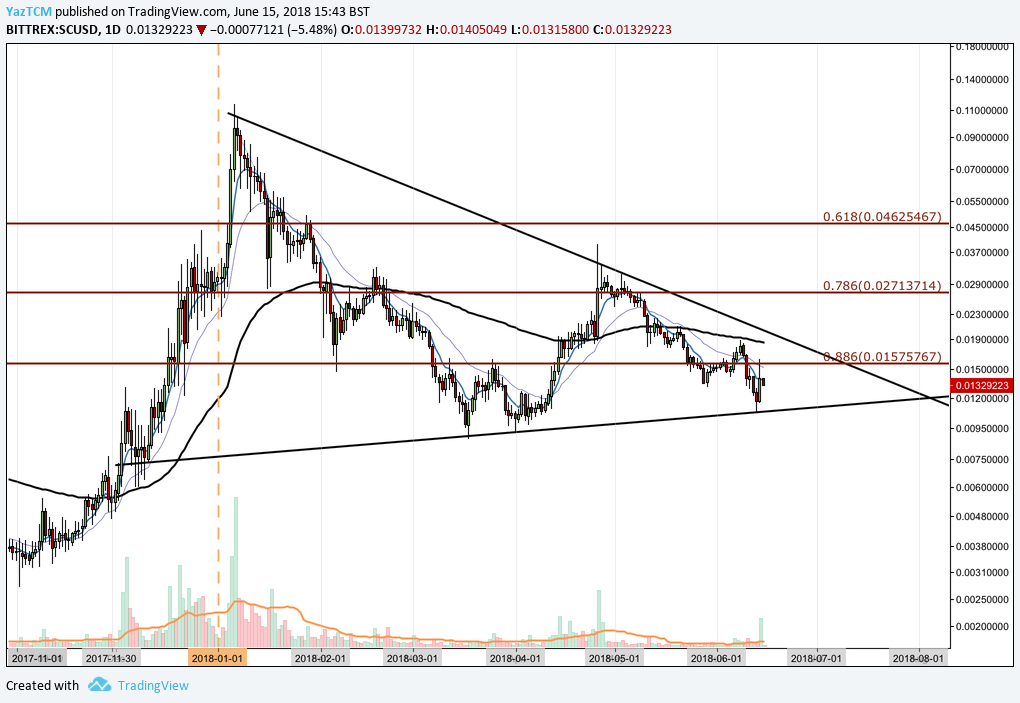
SC/USD – DAILY CHART – LONG TERM
https://www.tradingview.com/x/jqIwZwf8/
Looking at the charts from the advantage of a long term perspective, we can see that Sia, like most coins, has been struggling in trading against the USD this year having traded within the confines of a long term symmetrical triangle.
Price action had ended last year, 2017, with an incredible bullish rally as prices rose from a low of $0.00274 in early November 2017, to a high of $0.1152 on January 6, 2018. This was an incredible increase of over 3000% in terms of value from the low to the high.
Since this all time high in January, price action went on to depreciate throughout the year until reaching a low of $0.0087 placed on March 18. Sia continued to experience another bullish rally during April as price action rose over 300% from a high of $0.0092 to a low of $0.00395.
Price is currently trading at $0.0132 per Siacoin after being recently been rejected by the lower boundary of the 5 month old symmetrical triangle on June 13.
If the recent addition to Binacne helps increase the volume within the market then we could expect the bulls to apply the pressure within this market. Bulls first need to overcome near term resistance at the .886 Fibonacci Retracement with a price of $0.0157. This is a retracement of the incredible bullish run seen toward the end of 2017.
If the bulls within the market can overcome this price handle of $0.0157 then they are free to make an attempt at the upper boundary of the triangle. A break of the upper boundary would print a fresh new high for June and signal a short term bullish run up to $0.0271.
Let us look a little closer at price action over the more recent term.
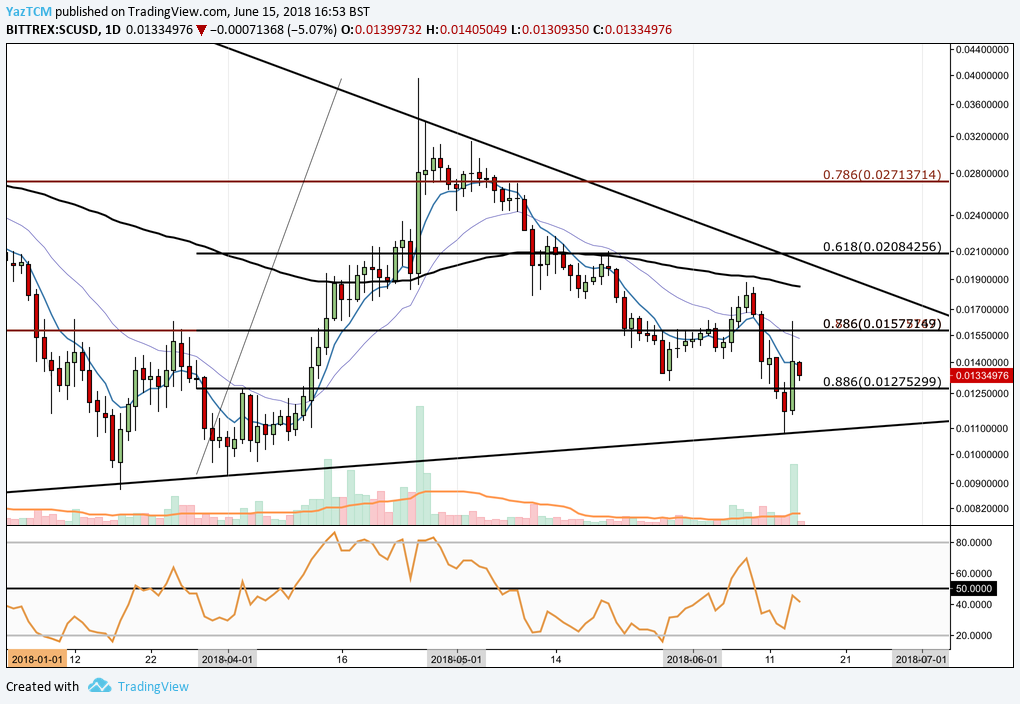
SC/USD – DAILY CHART – SHORT TERM
https://www.tradingview.com/x/A4NgmnRq/
Looking at the charts above we can see that price has retraced just past the .886 Fibonacci retracement of the 300+% bullish run experienced in April at a price of $0.127. Price action penetrated below this level and kissed the lower boundary of the symmetrical triangle before rebounding.
The recent bullish momentum initiated by the addition to Binance helped push price action past the .886 Fibonacci retracement all the way to the .786 Fibonacci retracement where it was strongly rejected at a price of $0.0157. It is important to note that this area also confluences with the long term .886 Fibonacci retracement so significant resistance is expected in this area.
If price action can, once again, find support at $0.127 we could expect price to make another retest of $0.0157 over the following few days. If the bulls can push us further, the market will be free to attempt to break above the triangle. However, for this to occur, significant momentum will be required which will be difficult to accumulate if the overall cryptocurrency market remains bearish.
The technical indicators are beginning to show slight signs of promise toward the bulls. The RSI is trading closely below the 50 handle indicating that the bearish pressure in the market is beginning to ease. If the RSI can break above 50 then this would be a sign that bullish momentum is beginning to build within the market.
Price action has found a small level of resistance recently at the 7-day EMA. If price action could break above this EMA this would be the first sign of a bullish swing brewing within the market. The 7-day EMA and the 21-day EMA would need to confirm before being able to confirm a short term bullish swing.
Let us look at how Siacoin has been trading against Bitcoin.
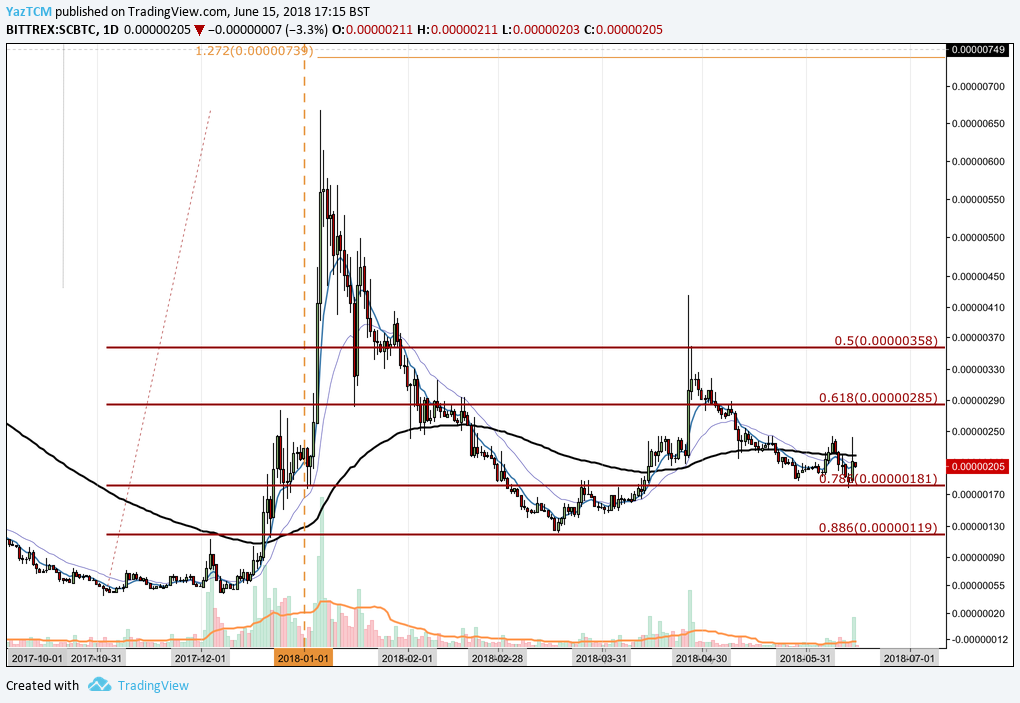
SC/BTC – DAILY CHART – LONG TERM
https://www.tradingview.com/x/aDYWW4fI/
Analyzing the chart above, we can see that Siacoin experienced an incredible bullish run during December 2017 and early January 2018 when price action rose from a low of 44 SATS to a high of 668 SATS.
Since posting this high, Siacoin went on to retrace up to the .886 Fibonacci retracement of this bullish run to a price of 119 SATS and then continued to trade, largely, between a range of 119 SATS and 358 SATS.
We can also see that for the past two months the market has been trading within a tighter range between the .618 Fibonacci retracement at 285 SATS and the .786 Fibonacci retracement at 181 SATS.
Whilst markets are range bound it is always difficult to tell in which way the market would like to break out from that range. If price action can break above 358 SATS again we could consider the market to be in a bullish market condition. Alternatively, If the market would go on to break below 119 SATS then we could consider the market trading condition to be bearish.
Let us inspect Sia against BTC a little closer.
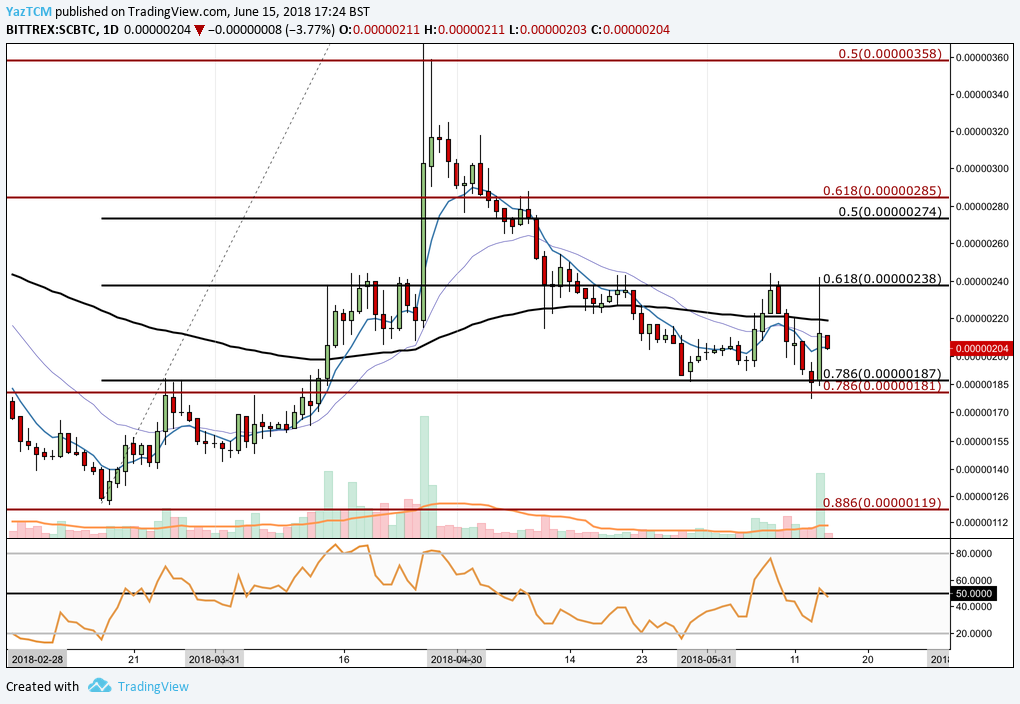
SC/BTC – DAILY CHART – SHORT TERM
https://www.tradingview.com/x/tav0ujAj/
Looking at the market from a closer time scale, we can see that Siacoin experienced a bullish run from the March 16 low of 121 SATS, all the way up to the April 26 high at 425 SATS.
The market has since retraced up to the .786 Fibonacci retracement of this bullish move to a price of 187 SATS and is currently trading in a tighter range to the long term range mention above. Price action is trading between a short term range between the .786 Fibonacci retracement at 187 SATS and the .618 Fibonacci retracement at 238 SATS.
If the bulls can garner enough momentum to push the market above 238 SATS then the market will be free to go on to near term resistance at 285 SATS.
The RSI is trading on the 50 level indicating the extreme indecision within the market. To add to this confusion, the 7-day EMA and the 21-day EMA are trading in a very constricted manner showing no indication in which direction they intend to head next.
Conclusion
With Siacoin trading within such a tight range against Bitcoin it is difficult to predict which way the market will want to trade in next. It is important to remain patient as a trader and wait for the market to show which direction it intends to break the range within.
We will be closely following volume over the next few weeks to see if the addition to Binance exchange will help Sia break out of the very tight range that it is currently trading within.
Related: Price Analysis: Factom Creates New Yearly Lows As Prices Find Short Term Support Against Bitcoin