
Bitcoin has done very well during 2019 after it managed to reverse the previous year-long bearish trend and start to climb higher again from the $3,000 price range. The cryptocurrency has continued to surge during the year, rising by a total of 98% over the past 3 months, and it managed to reach a high of $9,000 before recently rolling over and falling.
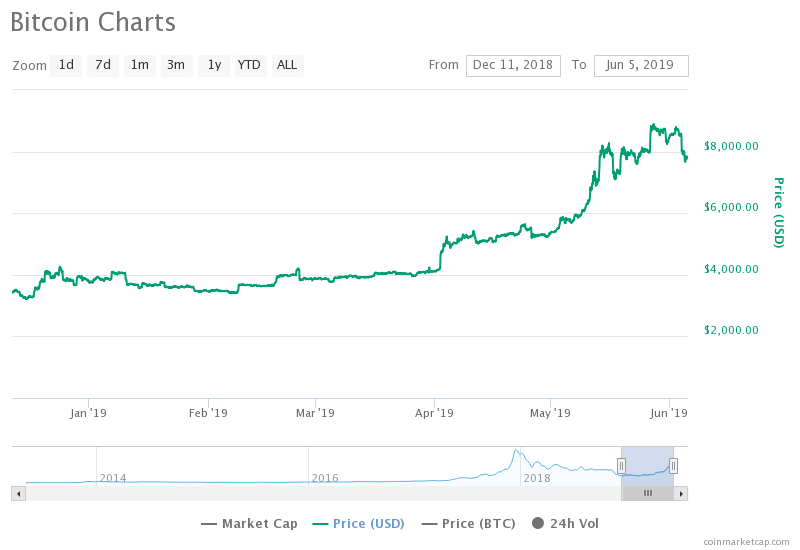
Source: CoinMarketCap
Bitcoin has now dropped by a total of 10% over the past week to where it is currently trading around the $7,740 level. Bitcoin currently has strong support beneath at $7,419 and $7,000, which should help stabilize this current round of selling.
In this article, we decided to look ahead and assess whether Bitcoin could rise and reach the target level of $13,000 before the end of Q3. There is little under 1 month remaining in Q2 2019, but Bitcoin has managed to increase by a total of 84% so far this quarter. To rise and reach the $13,000 price target, Bitcoin will need to increase by a total of 69% from the current price level. The last time Bitcoin was at the $13,000 price level was during January 2018 after the previous bull run started to collapse.
Let us continue to take a look at the Bitcoin market and highlight some potential areas of resistance on the way toward $13,000.
Bitcoin Price Analysis
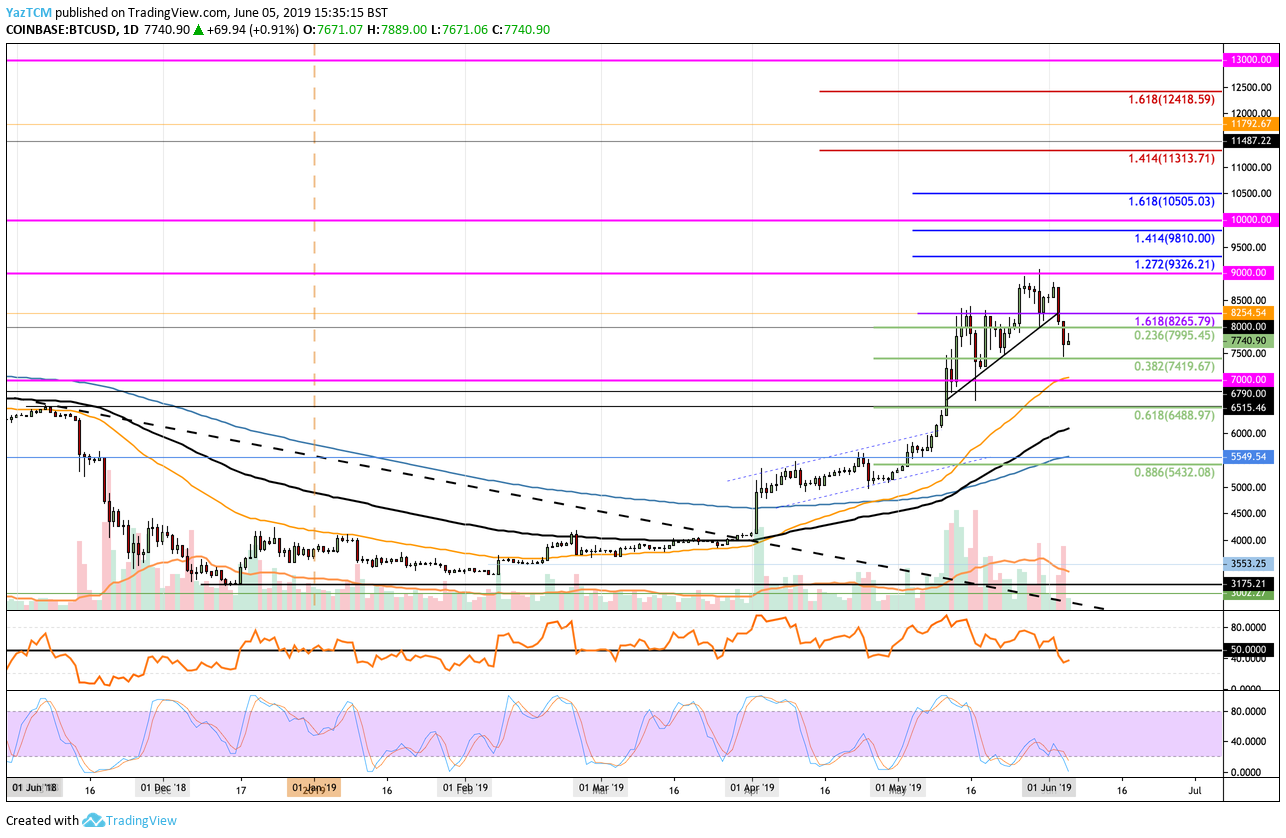
BTC/USD – MEDIUM TERM – DAILY CHART
What Has Been Going On?
Taking a look at the daily BTC/USD chart above, we can see that Bitcoin has recently rolled over from the resistance at $9,000 to find support lower at the short-term .382 Fibonacci Retracement level (drawn in green), priced at $7,420.
Where Is the Resistance Toward $13,000?
If the bullish pressure returns to the market, we can expect the first level of significant resistance above the market to be located at the $9,000 resistance level. Above this, we can expect more resistance to be located at the short-term 1.272 and 1.414 Fibonacci Extension levels (drawn in blue), priced at $9,326 and $9,810, respectively. This is closely followed with more resistance at the $10,000 level.
If the buyers can continue to clear the $10,000 level, further higher resistance is then located at the short term 1.618 Fibonacci Extension level (drawn in blue), priced at $10,500. The next levels of resistance above this are found at $10,700, $10,800, and $11,000.
Above $11,000, further higher resistance is then found at the medium-term 1.414 FIbonacci Extension level (drawn in red), priced at $11,313. This is followed with more resistance at $11,500, $11,800, and $12,000.
Before being able to make an attempt at the $13,000 target level, Bitcoin will need to overcome the resistance at the medium-term 1.618 Fibonacci Extension level (drawn in red), priced at $12,418.
Conclusion
Although $13,000 seems like a very long way away from the current price, it is only a 69% price increase. Considering that Bitcoin managed to surge by a total of 84% in Q2, it is not too outlandish to think 69% is attainable.
To reach the $13,000 resistance level, Bitcoin will need to overcome strong resistance at $9,000, $10,000, $11,300, and $12,400 before being able to make an attempt at the target.