
Bitcoin has been on a precipitous decline this week – falling by a total of 9.54% to bring the price of the cryptocurrency down to around $7,821. The cryptocurrency had experienced a slip in the bullish ascent toward the end of May 2019, and even poked its nose above the $9,000 level, only to fall toward $8,000 moments later.
However, despite the recent price declines, over the longer term, the trend for Bitcoin remains bullish, as the cryptocurrency has managed to climb by a total of 100% over the past 3 months.
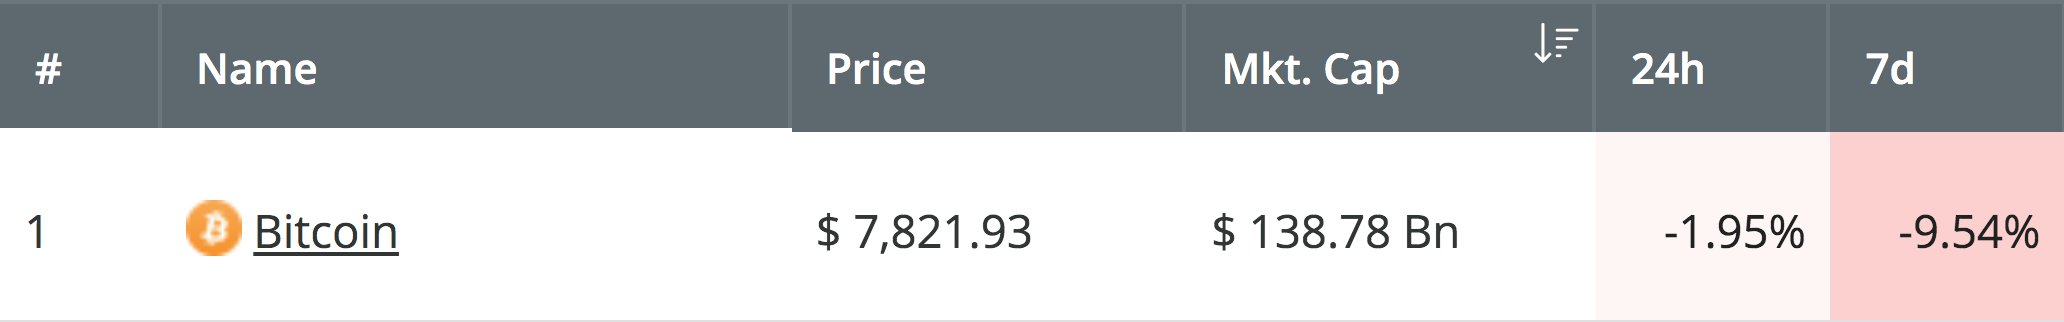
Source: CoinCheckup
After such an aggressive price increase over the past 2 months, it makes sense that Bitcoin would fall and start to retrace – it had to happen at some point. However, these are natural forces within the market, and investors should not panic.
The cryptocurrency recently rebounded from strong support at a short-term .382 Fibonacci Retracement level (drawn in green), priced at $7,419, and we can expect this to act as strong support moving forward.
Bitcoin currently holds a $128 billion market cap valuation after falling from a high above $150 billion last week.
Bitcoin Price Analysis
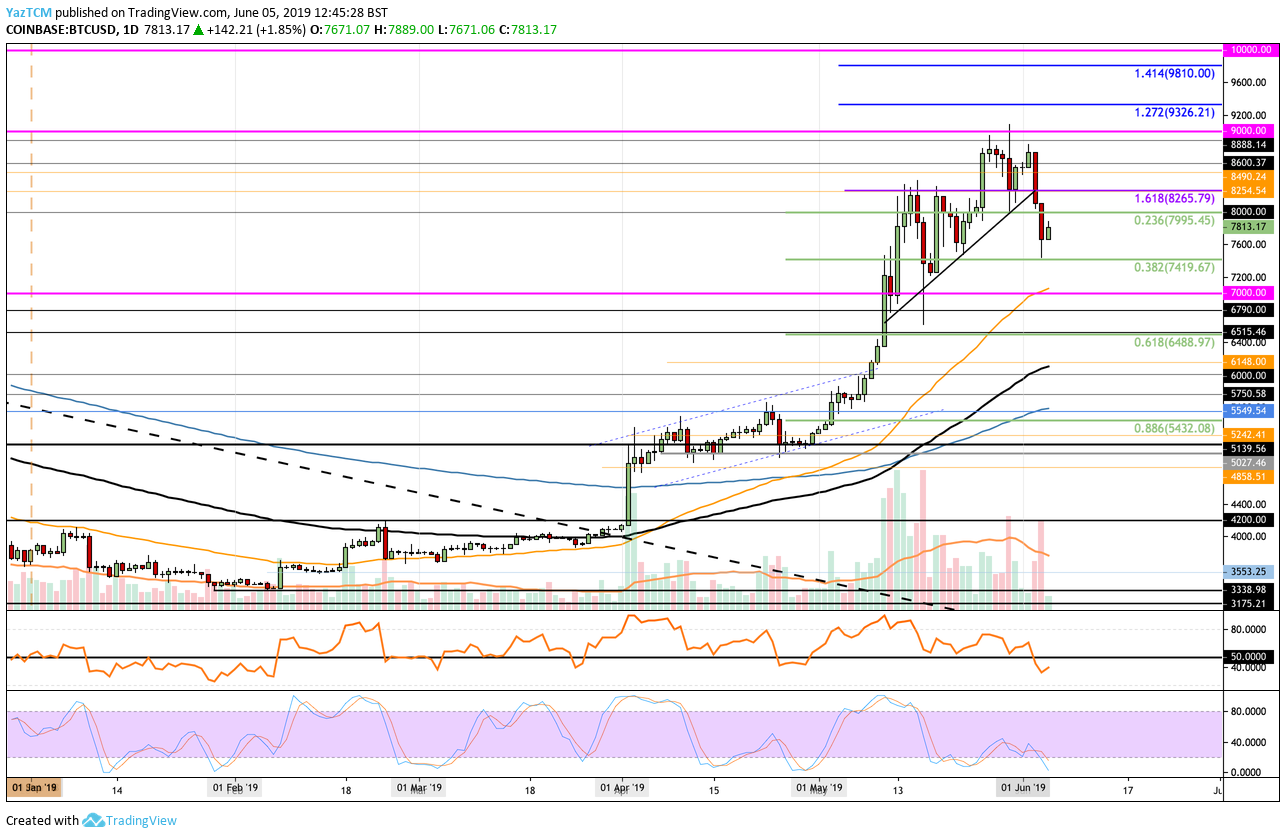
BTC/USD – MEDIUM TERM – DAILY CHART
What Has Been Going On?
Analyzing the daily BTC/USD chart above, we can clearly see Bitcoin was struggling to make movement above the $9,000 level, and proceeded to roll over and fall aggressively. The market went on to drop beneath a short-term rising trend line to fall further lower into the aforementioned support at the $7,419 level – where the bounce was experienced.
What Is the Current Trend
The current trend for the cryptocurrency remains bullish. For this trend to be invalidated, we would need to see Bitcoin fall and break beneath the $7,000 support level. For this trend to be considered bearish, Bitcoin would need to fall beneath $6,488.
Where Is the Support Beneath $7,419.67?
If the sellers continue to push BTC/USD beneath the support at $7,419, we can expect immediate strong support beneath to be located at the $7,200 and $7,000 levels. If the market continues to fall much further beneath $7,000, further support is expected at $6,790, followed with support at the short-term .618 Fibonacci Retracement level (drawn in green), priced at $6,488.
What Are the Technical Indicators Showing?
The RSI recently slipped beneath the 50 level for the first time since early May 2019, and even that time beneath 50 was short lived. The drop beneath 50 indicates that the sellers have taken control of the market momentum, and we could expect price action to drop further.
However, the Stochastic RSI is already within the oversold territory, which suggests that this current round of selling should not continue for too much longer.
Conclusion
Although Bitcoin may have seen a sharp price fall over the past few days – it is still not a cause for the bulls to worry. Bitcoin is still to be considered bullish until a break and close beneath the $7,000 support level. If the market does drop beneath $7,000, look for further support at $6,790 and $6,488.