
Bitcoin has seen a sharp decline totaling over 7% in the past 24 hours, bringing the cryptocurrency down beneath the $8,000 level. Just last week, Bitcoin had poked its nose above the $9,000 level, only for the cryptocurrency to crash hours later to the $8,200 range.
On the bright side, Bitcoin has still enjoyed a respectable 36.57% price increase over the past 30 trading days with a further – rather marvelous – 106% price explosion over the past 90 trading days.
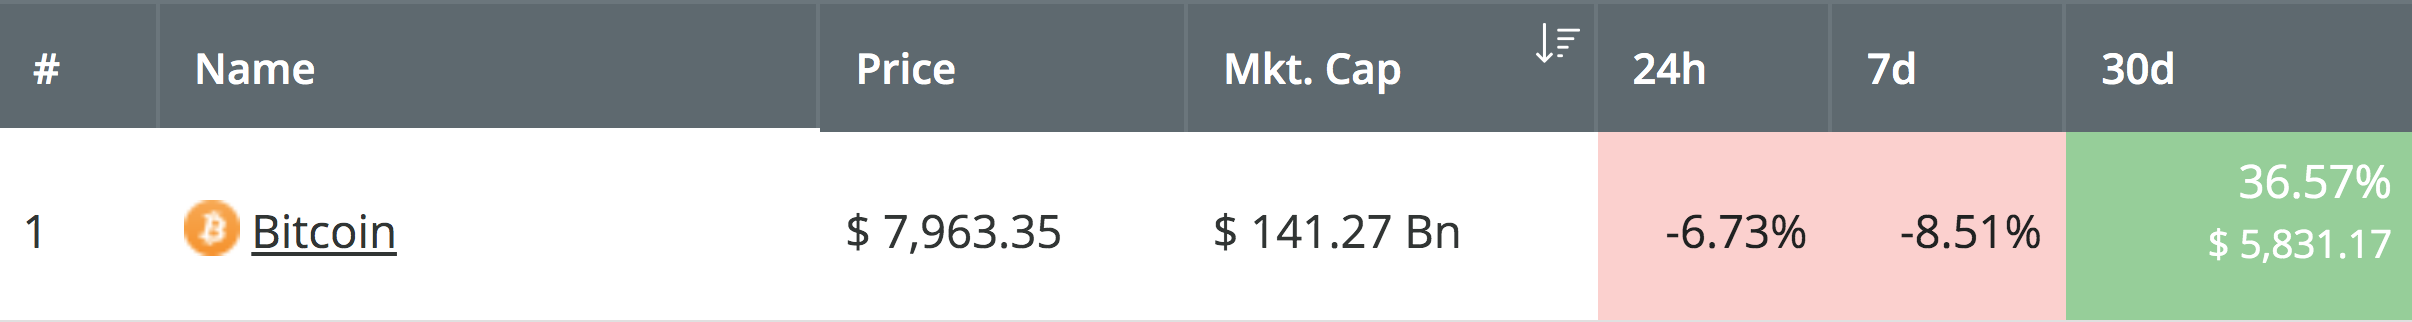
Source: CoinCheckup
Bitcoin currently holds a $141 billion market cap valuation after growing significantly from beneath the $100 billion value. The cryptocurrency has been surging aggressively for a couple of months now, so it was about time we saw a small retracement occur. The recent price drop has largely been attributed to a whale moving a significant amount of Bitcoin, around 25,000 BTC, between exchange wallets.
Regardless of why the price is falling, if it continues to break beneath the $7,900 level, there is a ton of support beneath. Let us take a look at the BTC/USD market and highlight some potential support toward the downside and see how far Bitcoin could fall.
Bitcoin Analysis
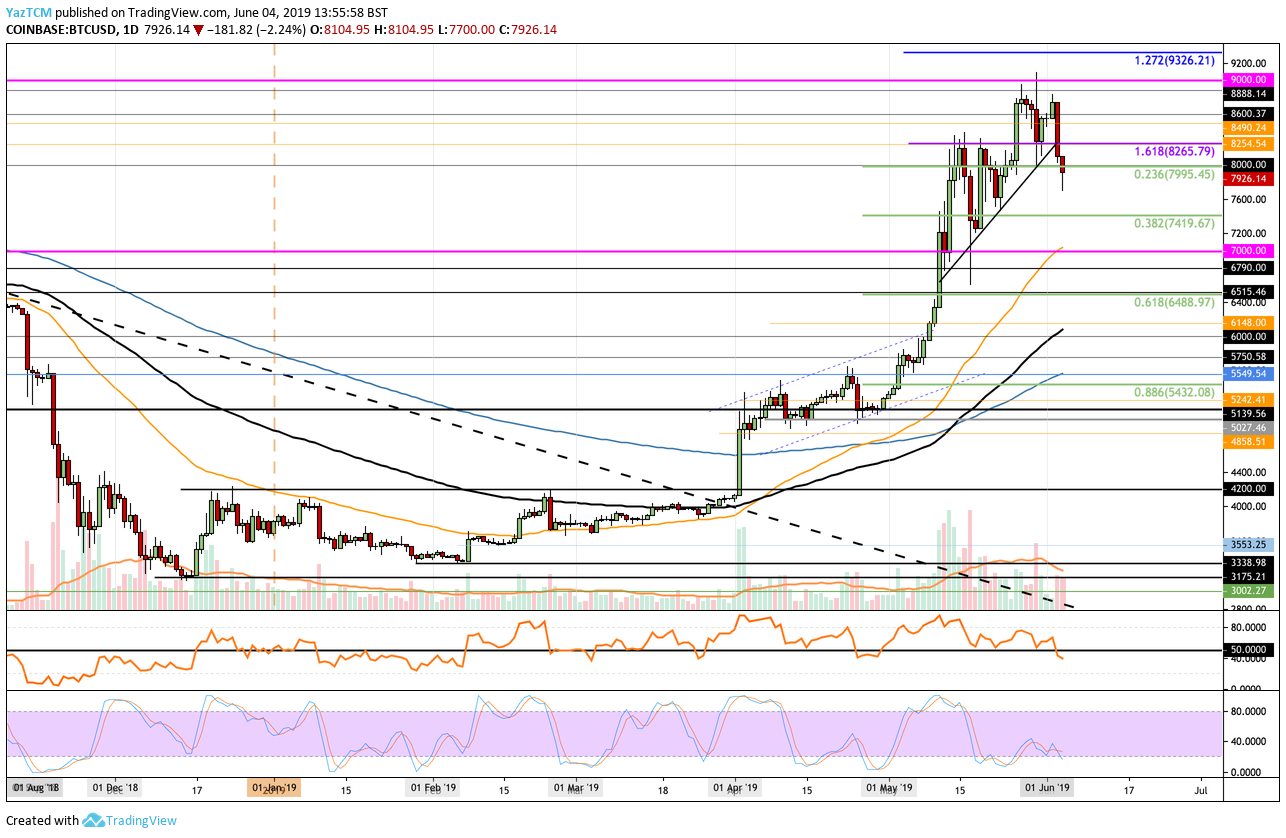
BTC/USD – MEDIUM TERM – DAILY CHART
What Has Been Going On?
Taking a look at the daily chart above, we can see that BTC/USD has recently turned away from the resistance near the $9,000 level and broken through a short-term ascending trend line to penetrate beneath the $8,000 level.
Bitcoin has already traveled as low as $7,700 in today’s trading session, but has since rebounded slightly back above $7,900.
The current trend for the market will remain bullish until price action falls and closes beneath the $7,000 support level, at which point the trend would be considered as bearish in the short term.
Where Is the Support Beneath $7,900?
If the selling continues to drop the price beneath $7,900, we can expect immediate further support below to be located at $7,600, followed with more support at the short-term .382 Fibonacci Retracement level (drawn in green), priced at $7,419. Beneath this, further support is expected at $7,200 and $7,000.
The support at $7,000 is relatively strong, but if the market collapses beneath here, we can expect immediate support below to be located at $6,790, $6,515, and then at the short-term .618 Fibonacci Retracement level (drawn in green), priced at $6,488.
Conclusion
After such an aggressive push higher, it was expected that price action may roll over and retrace slightly at some point. The important thing is that there is strong support toward the downside. If the market continues to fall we will look for support at $7,600, $7419, and $7,000 for a rebound to occur at.