- WAVES continues to make significant gains as the rest of the cryptocurrency industry suffers greatly.
- It is the strongest performing cryptocurrency over the past 7 trading days in the top 50 ranked projects.
- Support moving forward: $2.45, $2.33, $2.06, $1.80, $1.63, $1.44, $1.32, $1.14.
- Resistance moving forward: $2.87, $3.09, $3.27, $3.40, $4.00, $4.32.
Latest Waves News
Waves has continued to surge after the release of its updated mobile wallet, which also allows users to purchase Waves directly with a credit card.
The market has broken above the $2.50 handle in today’s session and doesn’t look like it’s slowing down.
Another thing that doesn’t seem to be slowing down is the development from the Waves team.
They have recently released an add-on for the Mozilla Firefox web-browser, with plans to closely follow with a Google Chrome plug-in as well.
After releasing and activating the capabilities for smart contracts on the Waves mainnet platform earlier in September, the team plans to extend this development with the release of Smart Assets and Smart Account Trading.
Smart Assets are virtual currency tokens which represent ownership of tangible real-world assets that can be bought, sold or even exchanged.
The “smartness” comes into play as the tokens will be defined by a particular set of rules that will be attached to the Smart Asset through a script.
Similarly, Smart Accounts are Waves accounts which have a script attached to the account. The script will validate every transaction through the account, defined by the rules of the script, before the transaction is confirmed.
Both Smart Assets and Smart Accounts have now been included into the mainnet, and will require 80% of the miner votes for the upgrade to be activated.
At the time of writing, currently around 27% of the miners have voted for both features.
And they are not stopping there as the team has big and exciting plans ahead, including the launch of a VFA exchange in Malta and a securities trading platform scheduled for Q3 2019.
Let us continue to take a look at price action for WAVES over the short term and highlight any important areas of support and resistance moving forward.
WAVES Price Analysis
Waves has seen an increase totaling 5.77% over the past 24 hours of trading as the cryptocurrency now trades at a price around $2.54, at the time of writing.
The Waves cryptocurrency is the best performing project out of the top 50 ranked cryptocurrencies over the past 7 trading days as the market explodes by over 57%.
The 30 -month old project is now ranked in 22nd position and currently retains a $249 million market cap value.
WAVES has seen a 68% price increase over the past 30 trading days when the majority of the rest of the market have suffered heavy losses totaling over 50%.
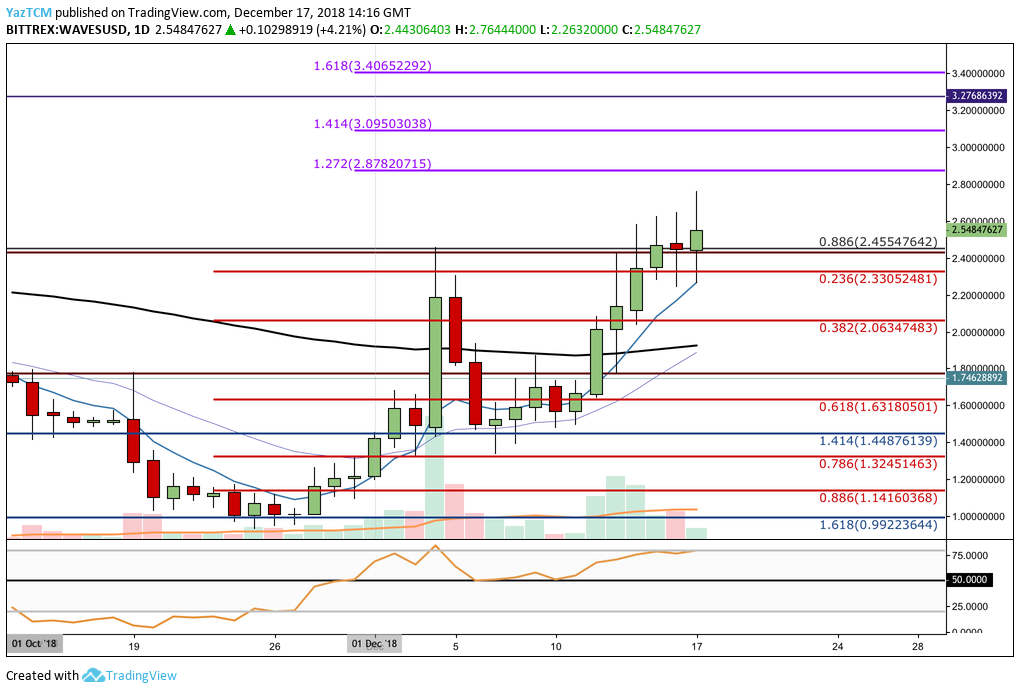
Since our last Waves analysis, we can see that WAVES/USD dropped slightly before continuing its aggressive bullish run.
The market dropped into the $1.50 region but rebounded at support provided by the previous long-term downside 1.414 FIbonacci Extension level (drawn in blue) priced at $1.44.
WAVES/USD has now managed to break above the long-term .886 Fibonacci Retracement level (drawn in black) priced at $2.45.
However, today’s market candle is yet to close above.
Trend: Bullish Above $2.50
The overall trend for the month has most certainly been bullish.
If the buyers can continue to remain above the $2.50 handle, we can assume that the trend will continue upward.
However, price action may break beneath $2.50 once again before being able to climb further higher in the long term.
Where is the Next Level of Significant Resistance Above $2.50?
If the buyers within WAVES/USD continue on their aggressive climb upward, we can expect the next area of resistance to be located at the short-term 1.272 Fibonacci Extension level (drawn in purple) priced at $2.87.
Further significant resistance above this level can be expected at the short-term 1.414 and 1.618 Fibonacci Extension levels (drawn in purple), priced at $3.09 and $3.40 respectively.
Where is the Support for WAVES Located Beneath $2.50?
If the bulls run out of steam, as they are overextended, we could expect a slight “pull back” or Retracement before the WAVES/USD market can continue higher.
In this case, we can expect immediate support beneath $2.50 to be located at the .236 and .382 Fibonacci Retracement levels (drawn in red), priced at $2.33 and $2.06 respectively.
If the sellers continue to drive price action for WAVES/USD further lower, we can then expect more support below at the .618 Fibonacci Retracement level (drawn in red) priced at $1.63, closely followed by the previous downside 1.414 Fibonacci Extension level (drawn in blue) priced at $1.44.
What Are the Technical Indicators Showing?
The RSI is in extreme overbought territory for WAVES/USD as it trades at the 75 handle.
This could be an indication that the bulls need a slight break before being able to continue higher, which could result in a small pullback.
If this is the case, so long as the RSI remains above the 50 handle, we can assume that the bullish momentum will continue to drive the market higher.
Conclusion
The Waves team has made remarkable progress despite the poor year of performance within the cryptocurrency industry. As a result, they have managed to make gains in price action where other cryptocurrencies have suffered greatly.
The break above $2.50 should indicate that price action still wishes to travel much higher.
If the market does pull back before then, look for the short-term Fibonacci Retracement levels for support where the market could rebound.