
-
WAVES/USD has been on an extraordinary run throughout the start of December 2018 upon the launch of their new mobile application.
-
The market ran into resistance at $2.45 and the upside in limited until price action breaks above $2.50.
-
Support moving forward: $2.10, $2.00, $1.88, $1.76, $1.51, $1.44, $1.26, $1.10, $1.00.
-
Resistance moving forward: $2.45, $2.50, $2.87, $3.00, $3.09, $3.27, $3.40.
Latest Waves News
The Waves market has recently enjoyed a price surge totaling over 84% since the announcement of their brand-new mobile application. On December 3, Waves released major updates to the application that take its functionality above and beyond many of its competitors’ wallets.
The new all-in-one mobile application now allows users to access all the functions of the Waves platform from the convenience of their mobile devices. For instance, users can access the Waves DEX (decentralized exchange) on the go, granting them access to the 60+ trading pairs from their mobiles.
The team has also made sure to keep privacy and security in mind while redesigning the application. All traffic is encrypted by default and the private keys within the wallet are also encrypted and stored locally. This reduces the risk of an outside hack as the user’s private keys are never broadcasted to the internet.
To further improve to security, the Waves team has also incorporated the usual security process one would expect to find on a well-designed finance application, such as facial identification, Touch ID, and fingerprint scanning.
The release of the polished application opens the doors for the billions of users that are in possession of smartphones around the globe. The application is available on both the Google Play Store and the Apple App Store.
Let us continue to take a look at how the announcement has affected price action for Waves.
Waves Price Analysis
Over the last 24 hours of trading, the WAVES/USD market has seen a price increase totaling 41%, as the cryptocurrency presently trades hands around a price of $2.20, at the time of writing. This price hike is extended to a further 103% over the past 7 trading days.
The Waves project is now ranked in 25th position in terms of market cap rankings and holds a market cap value of $211 million.
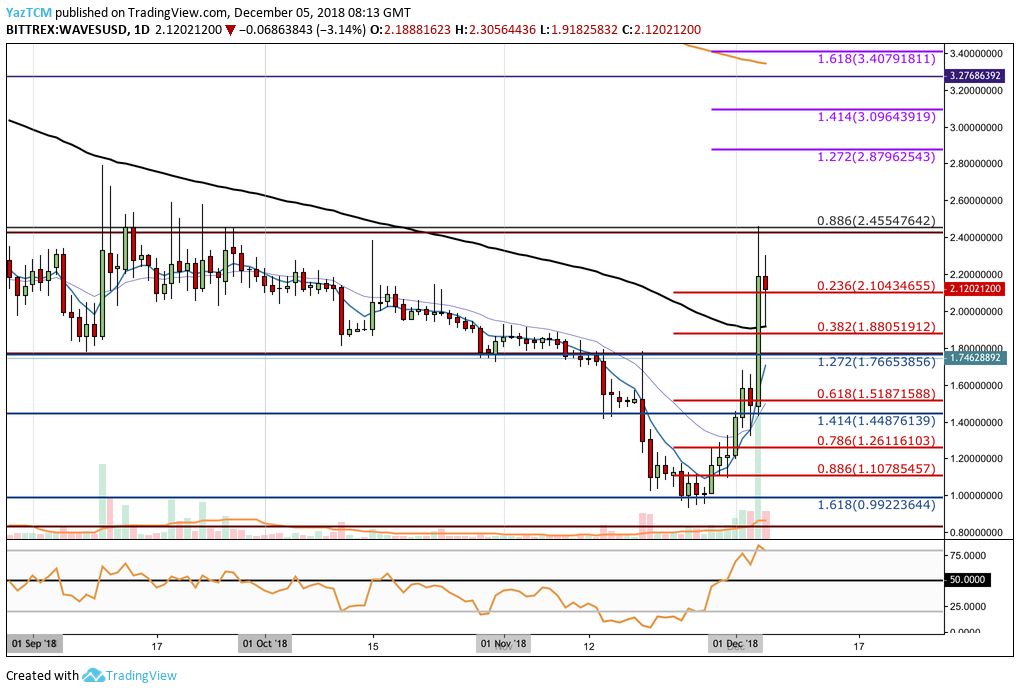
Analyzing price action from the short-term chart above, we can see that Waves had been declining against the USD for the previous 2 months before reaching support at a medium-term downside 1.618 FIbonacci Extension level (drawn in blue) priced at $0.9922 in November 2018.
The market then went on to rebound from this support level and has extended by an extraordinary 164% since reaching the support on November 25, 2018. Price action went on to rally into resistance provided by the long-term .886 Fibonacci Retracement level (drawn in black) priced at $2.45 before rolling over slightly.
Trend: Bullish — Providing Price Action Breaks Above $2.50
Although the market has been on an incredible run over the past few days leading to a short-term bullish run, we cannot assume that price action is bullish in the long term until the market breaks up above previous resistance, around the $2.50 handle.
What If WAVES/USD Breaks Above $2.50?
If WAVES/USD can break above $2.50m, we can expect the market to continue to climb higher into resistance provided by the short-term 1.272 Fibonacci Extension level (drawn in purple) priced at $2.87.
If the buyers can then continue to break up above resistance at $3.00, we can expect further higher resistance to be located at the short-term 1.414 and 1.618 Fibonacci Extension levels (drawn in purple), priced at $3.09 and $3.40 respectively.
What If WAVES/USD Fails To Break Above $2.50?
If price action fails to break above $2.50 and rolls over, we can expect the market to retrace slightly into the short-term .236 and .382 Fibonacci Retracement levels (drawn in red), priced at $2.10 and $1.88 respectively.
If the selling pressure continues to drive price action even lower, we can expect more support beneath to be located at the previous downside 1.272 Fibonacci Extension level (drawn in blue) priced at $1.76, followed by the short-term .618 Fibonacci Retracement level (drawn in red) priced at $1.51.
What Are the Technical Indicators Showing?
The RSI has now reached extreme overbought conditions after the incredible run seen over the past few days.
The momentum is certainly in the favor of the bulls at this moment in time. However, if we would like to see price action continue to travel higher, the RSI may need to pull back slightly before being able to climb upward once again.
Price action has also managed to recently break back above the 100-day moving average (black moving average) for the first time since April 2018. If the market can remain above this moving average, we can expect price action to continue to travel higher.
Conclusion
WAVES/USD has been on an extraordinary run over the past few trading sessions and has recently run into strong long-term resistance at $2.45.
As the market is extremely overextended (according to the RSI), we could expect price action to retrace slightly into either the short-term .382 or .618 Fibonacci Retracement levels before being able to continue its ascension.