
- VeChain Thor has recently announced a partnership with Milly to use their RFID chips in their products.
- Support moving forward: $0.0042, $0.00416, $0.0040, $0.003780, $0.003551, $0.003454.
- Resistance moving forward: $0.004437, $0.004708, $0.005044, $0.005237, $0.006226, $0.006435.
Latest VeChain Thor News
VeChain Thor has recently announced a new partnership with one of the largest memory foam research, development and manufacturers in China. The company, Mlily, is also the official global partner of Manchester United Football Club.
The partnership will see Milly use the VeChain Proof-of-Origin, Proof-of-Authenticiy and Supply Chain Management tools. They have estimated that over 20 million RFID chips will be implemented into their products over the next 5 year period.
In other VET news, CoinEx has recently announced that they have completed their VeChain mainnet token swap:
Announcement on VeChain mainnet token swaphttps://t.co/F3ZLolMQR5 pic.twitter.com/aADnnuXg9h
— CoinEx (@coinexcom) January 23, 2019
Let us continue to analyse price action for VET/USD over the recent term and highlight some potential areas of support and resistance moving forward.
VET Price Analysis
VET has seen a price fall totaling 2.87% over the past 24 hours of trading, but is still up by a total of 6.92% over the past 7 trading days. The cryptocurrency is now trading at a price of $0.004394, at the time of writing.
VeChain is now ranked in 25th position as it currently holds a market cap valuation of $239 million, up from the previous $213 million at the time of writing our previous VET/USD analysis. VeChain has seen a significant 61% price plummet over the past 90 trading days and now trades at a value that is 78% lower than the all-time high price.
VET/USD Price
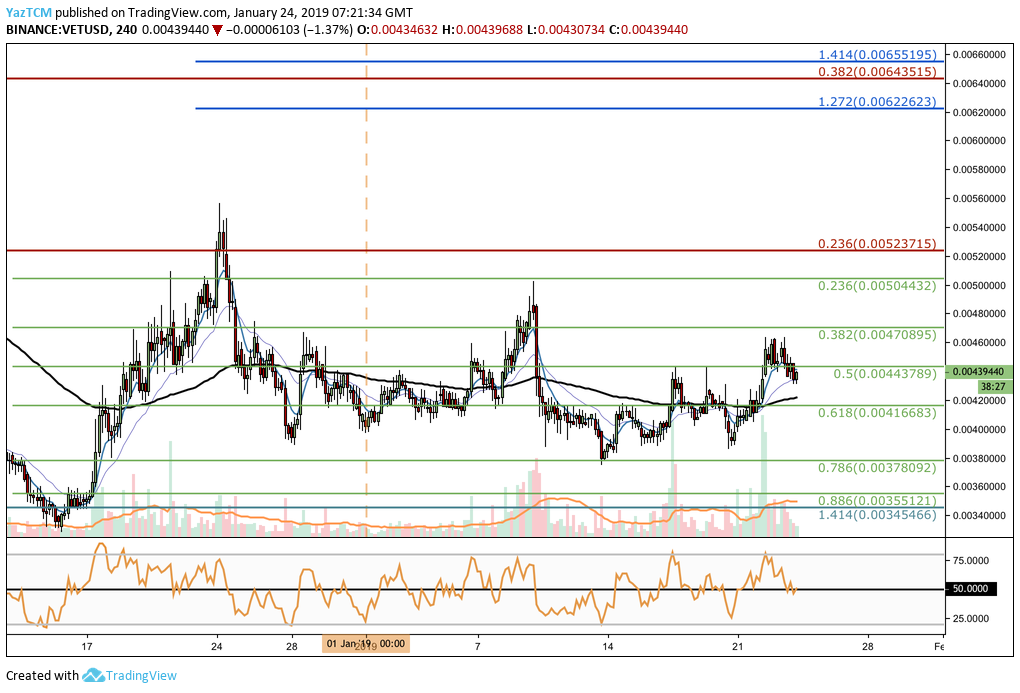 Taking a look at price action for VET/USD over the 4-hour chart above, we can see that VET/USD rebounded from the support at the .786 Fibonacci REtracement level (drawn in green) priced at $0.003780, highlighted in our last analysis. Price action then went on to break above the $0.0042 handle and reached a high around $0.0046 before the bullish run stalled.
Price action is now trading below resistance at the short-term .5 Fibonacci Retracement level (drawn in green) as price action currently sits around the $0.0043 handle.
Trend: Neutral
The market has now turned from a bearish trending condition to a neutral one. If the market can go on to break above the $0.0047 handle, then we can consider the market bullish in the short term.
A price action break below the $0.0037 handle would be a signal for a bearish market.
Where is the Resistance Above the <arket?
If the bulls can push VET/USD above the resistance at the short-term .5 FIbonacci Retracement level (drawn in green) priced at $0.004437, further resistance above will then be located at the $0.0046 handle. More resistance is located at the short-term .382 Fibonacci Retracement level (drawn in green) priced at $0.004708.
If VET/USD goes above the $0.0050 handle, there is more resistance above at the bearish .236 Fibonacci Retracement level (drawn in red) priced at $0.005237.
More resistance above the $0.0060 handle is then to be expected at a medium-term 1.272. Fibonacci Extension level (drawn in blue) priced at $0.006226, followed by the bearish .382 Fibonacci Retracement level (drawn in red) priced at $0.006435.
Where is the Support Located Below the Market Price?
If the sellers begin to push price action lower for VET/USD, we can expect support below to initially located at the short-term .618 and .786 Fibonacci Retracement level (drawn in green) priced at $0.004166 and $0.003780.
More support below this level can be found at the short-term .886 Fibonacci Retracement level (drawn in green) priced at $0.003551. The downside 1.414 Fibonacci Extension level (drawn in blue) priced at $0.003454 is the next level of support available.
VET/BTC Price
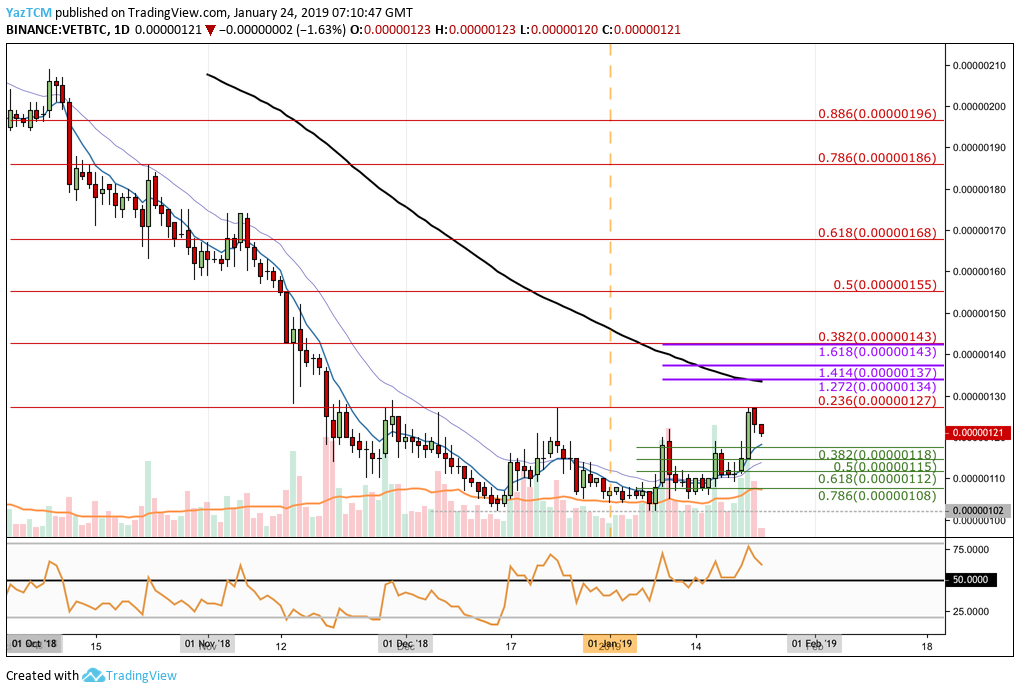
Analyzing the VET/BTC market from the daily chart above, we can see that since October 2018 price action has fallen by a substantial 50% from a high above 200 SATS to a low of 102 SATS towards mid-December 208.
As price action reached this area of support, the market went on to rebound during January 2019 but recently met resistance at the bearish .236 Fibonacci Retracement level (drawn in red) priced at 127 SATS. This Fibonacci Retracement is measured from the high seen in October 2018 to the low of December 2018.
Trend: Bullish
The recent break higher toward the 127 SATS handle has pushed VET/BTC into a short-term bullish trend. For this trend to continue, price action needs to break above 127 SATS.
For this market to be considered bearish, we would need to see price action break below 102 SATS.
Where is the Support Below the Market?
As price action looks to be heading lower, we can expect immediate support towards the downside to be located at the short-term .382 and .5 FIbonacci Retracement level (drawn in green), priced at 118 SATS and 115 SATS respectively.
If the market continues to head further lower, more support beneath is located at the short-term .618 and .786 Fibonacci Retracement level (drawn in green), priced at 112 SATS and 108 SATS respectively.
Where Will the Market Meet Resistance Above 127 SATS?
If the bulls can push price action above the current resistance at 127 SATS, expect immediate higher resistance at the short-term 1.272 and 1.414 Fibonacci Extension levels (drawn in purple), priced at 134 SATS and 137 SATS respectively.
If the bulls continue higher, there is more resistance above the bearish .382 Fibonacci Retracement level (drawn in red) priced at 143 SATS. This area of resistance is also bolstered by the short-term 1.618 Fibonacci Extension level (drawn in purple) priced at the same level.
Further resistance towards the upside can then be located at the bearish .5 and .618 Fibonacci Retracement levels (drawn in red) priced at 155 SATS and 168 SATS, respectively.
Conclusion
VeChain continues to garner partnerships for the real-world use of their blockchain technology in supply chain management. If we see VET/BTC breaking above the 127 SATS handle over the next few days, we can expect the price of VET/USD to continue higher.