- My Story have recently announced the launch of their wine bottle verification system with VeChain.
- The market has recently rebounded from support at $0.003780.
- Support moving forward — $0.003790, $0.0037, $0.0036, $0.003551, $0.0035, $0.003454, $0.003285.
- Resistance moving forward — $0.004166, $0.004265, $0.004437, $0.004708, $0.0050, $0.005237, $0.006226.
Latest VeChain News
In September 2018, we wrote an article regarding the VeChain partnership with BYD in the hopes of creating a proof of concept solution for “carbon banking” for automobiles.
It appears that the company that VeChain have partnered with have experienced an increase in sales during 2018. During the aforementioned year, sales have increased for BYD vehicles by a total of 25%. The company have sold over 520,000 vehicles and are on track to sell more during 2019.
This is great news for VeChain, as their partnership involves collecting data from vehicles sold by BYD to create an economy for the internet of vehicle information, by recording and storing data on the VeChain blockchain.
In other VeChain news, the VeChain collaboration with My Story has started to roll out their initial product, which will use VeChain hardware tags. The VeChain Dapp collaboration is with DNV-GL, a leading global provider of product assurance and certification.
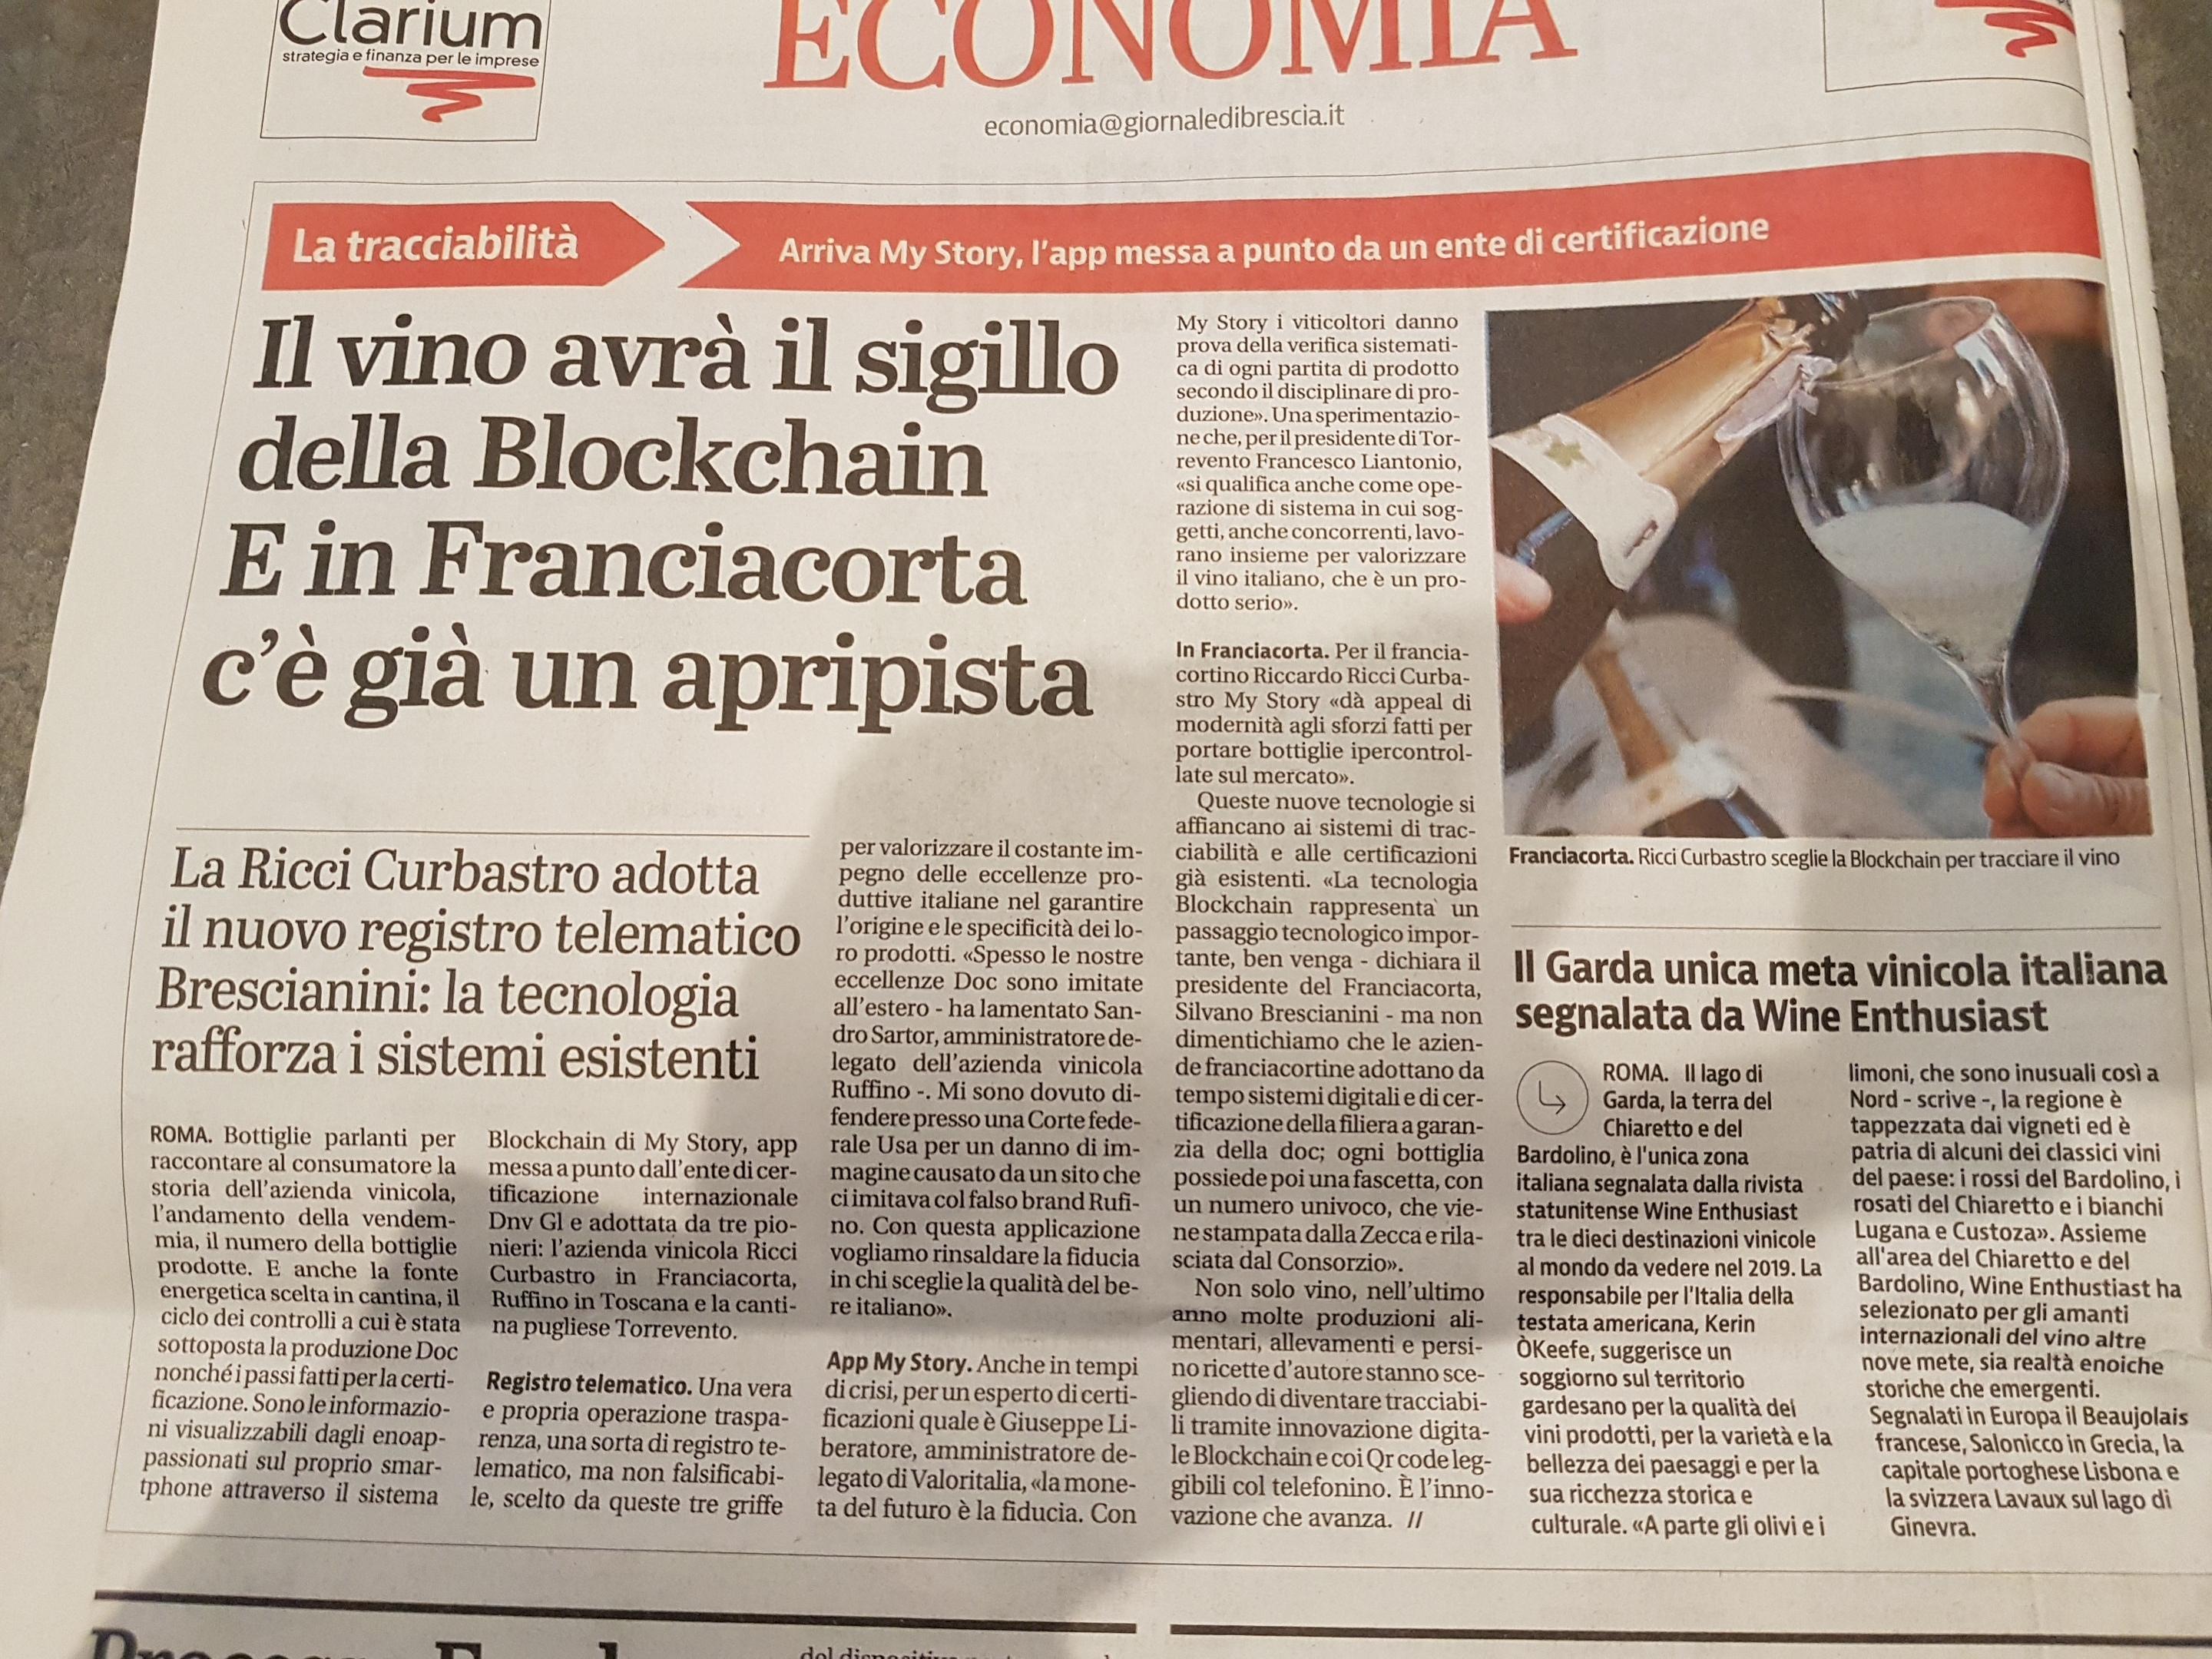
My Story have partnered with 3 leading wineries in Italy: Rick Curbastro, Ruffino Wines, and West Wind Wines. 3 companies will tag their bottles with the My Story label that will utilize VeChain hardware tags. The labels can be scanned by the user to learn about the history of their wine bottles from the grape to the bottle, so consumers can be assured that everything is verified and legitimate.
Today in Rome we launch #MyStory™ feat. leading Italian wineries @Ricci_Curbastro, #RuffinoWines @Torrevento! Scan the QR code to discover the history of each wine, from grape to bottle #blockchain #digitaltrust @vechainofficial @lucacrisciotti @rgrottola https://t.co/98dzTZqhDq pic.twitter.com/K1cEOd0XoO
— DNV GL (@DNVGL) January 10, 2019
All the information gathered through the My Story process will be stored on the VeChain Thor public blockchain. The news has even made it into the economy section of main newspaper in Brescia.
Let us continue to analyze price action for VET/USD over the recent term and proceed to highlight any potential areas of support and resistance moving forward.
VeChain Thor Price Analysis
VET has seen a small price decline totaling 3.70% over the past 24-hour trading session, bringing the current trading price down to $0.003837. The cryptocurrency has now lost a total of 9.86% over the past 7 trading days, but is up a small 2.92% over the past month.
VeChain is now ranked in 25th position in the market cap rankings, as it currently holds a market cap value of $213 million. The cryptocurrency has undergone a serious price fall totaling 66% over the past 90 trading days, and now trades at a value that is 80% lower than the all-time high price.
VET/USD — SHORT TERM — 4HR CHART
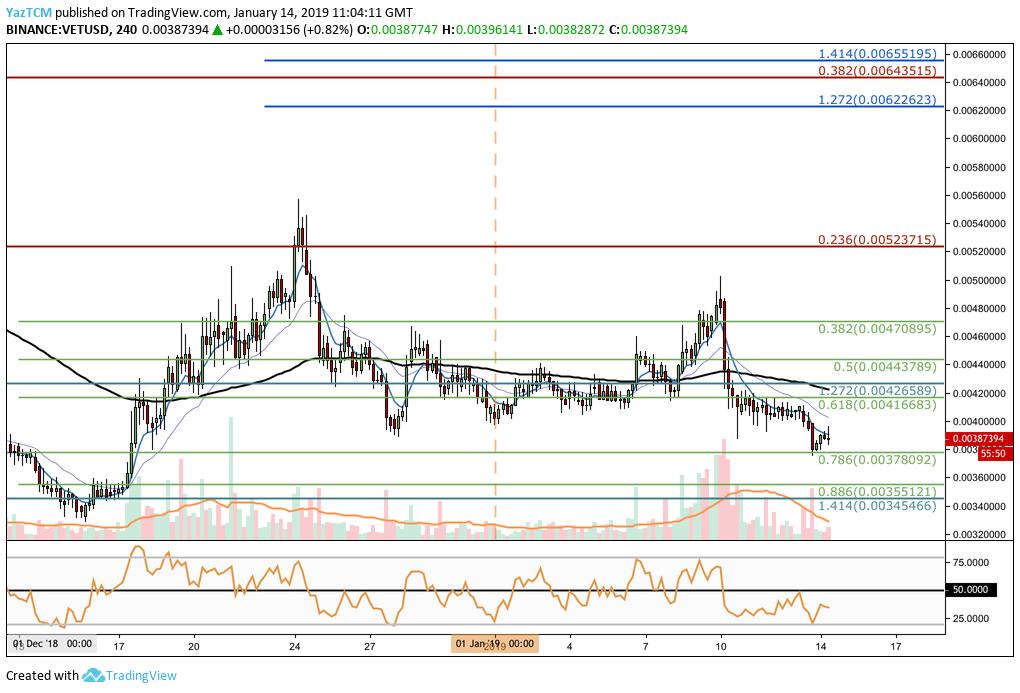
Observing price action from the 4HR Chart above, we can see that the market rebounded from the December 2018 low at $0.003285 and then continued to rally. VET/USD proceeded to rally up into resistance slightly above the bearish .236 Fibonacci Retracement level (drawn in red) priced at $0.005237 before rolling over.
After reaching the resistance, the market began to fall and continued to do so during the start of 2019. VET/USD has recently now reached resistance at a short term .786 Fibonacci Retracement level (drawn in green) priced at $0.003780.
TREND — BEARISH in the short term
The market break below the $0.0040 handle has signaled a trend shift to a bearish trading condition in the short term. We would need to see price action break back above the $0.0040 handle to resume a neutral trend.
For this market to be considered bullish, we would need to see price action break above the $0.00050 handle.
Where is the resistance toward the upside?
If the buyers can regroup and begin to push price action higher, we can expect immediate resistance toward the upside to be located at the short-term .618 Fibonacci Retracement level (drawn in green) priced at $0.004166.
If buying pressure continues to drive price action further above this level, we can then expect further higher support to then be located at the short-term .5 and .382 Fibonacci Retracement levels (drawn in green) priced at $0.004437 and $0.004708 respectively.
More resistance toward the upside can then be expected at the 2019 high around the $0.0050 handle, followed by further resistance at the bearish .236 Fibonacci Retracement level (drawn in red) priced at $0.005237.
If the bulls continue to cause VET/USD to climb even further higher, more resistance above can then be located at the medium-termed 1.272 and 1.414 Fibonacci Extension levels (drawn in blue) priced at $0.00622 and $0.00655 respectively.
Where is the support located below the market?
If the sellers begin to push price action lower, we can expect immediate support toward the downside to be located at the short-term .786 Fibonacci Retracement level (drawn in green) priced at $0.003780. Further support below this can then be expected at the short-term .886 Fibonacci Retracement level (drawn in green) priced at $0.00355.
If the bears continue to drive price action lower, further support can then be expected at the previous long-term downside 1.414 Fibonacci Extension level (drawn in blue) priced at $0.003454, followed by the 2018 low-priced at $0.003285.
What are the technical indicators showing?
On the 4HR time frame, the RSI has recently rebounded from the oversold threshold at the 20 level. However, the market is still trading below the 50 level, which indicates that the bears are still in control of the market momentum. For a recovery to be seen in the VET/USD market, we would need to see the RSI break back above the 50 handle.
Conclusion
VeChain have amassed some high profile partnerships, which have recently swung into action with the My Story wine bottle collaboration. For a more in-depth overview of the milestones achieved by VeChain in 2018, we recommend taking a look at the 2018 year review.