
- Support for TRX moving forward: $0.02681, $0.02510, $0.02402, $0.02122, $0.020, $0.01725, $0.01488.
- Resistance for TRX moving forward: $0.02739, $0.02855, $0.030, $0.03140, $0.03503, $0.03689.
Latest TRON News
The recent TRON NiTron summit revealed a great deal about the future of dapps on the TRON blockchain. Developers have only had a 3-month period so far to develop dapps on the TRON blockchain. But in such a short space of time, the blockchain has already hosted around 145 dapps.
At the summit, TRON CEO Justin Sun spoke about the future of dapps in 2019. He believes that at some point during the year, there will be a total of 2,000 dapps on the TRON blockchain. He also added that he doesn’t care where the developers come from, whether EOS or Ethereum; he just wants developers to move on to TRON’s powerful blockchain.
Let us continue to take a look at price action for TRX over the recent period and highlight some areas of support and resistance moving forward.
TRX Price Analysis
TRX has seen a small price increase totaling 0.61% over the past 24 hours of trading, bringing the current trading price up to $0.02710, at the time of writing. The cryptocurrency has now seen a 7% price hike over the past 7 trading days, with a further 37% price surge over the past 30 trading days.
TRON remains in the 9th position and currently holds a $1.79 billion market cap value. The 16-month old project now trades at a value that is 89% lower than its all-time high price.
TRX/USD Price
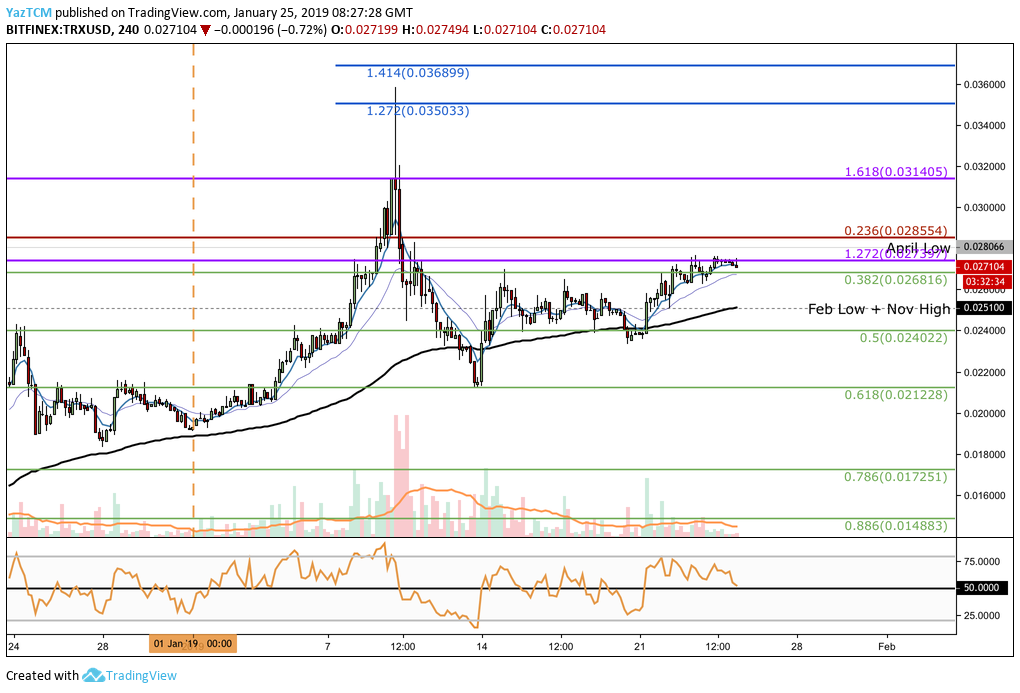
From the TRX/USD 4-hour chart above, we can see that the market has penetrated above our previously highlighted resistance area at the short-term .382 Fibonacci Retracement level (drawn in green) priced at $0.02681.
This has resulted in TRX breaking above the previous narrow trading range.
However, the market did not travel too much higher as the price increase stalled at the previous medium-term 1.272 Fibonacci Extension level (drawn in purple) priced at $0.02739. The market is now struggling to break above this resistance, and looks like it may reverse.
Trend: Bullish in the Short Term
As the market has managed to break above the trading range, we can now consider this market to be bullish in the short term.
However, the market is struggling at the resistance around the $0.02739 handle and if price action dips back below the $0.02681 handle, the trend will return to a neutral one.
For this trend to be considered bearish, we would need to see price action head lower and break below the $0.02122 handle.
Where is the Resistance Towards the Upside?
If TRX goes above the $0.02739 resistance level, we can expect higher resistance at the bearish .236 Fibonacci Retracement level (drawn in red) priced at $0.02855. This will be closely followed by more resistance at the medium-term 1.618 Fibonacci Extension level (drawn in purple) priced at $0.03140.
If the buyers can push TRX/USD above the $0.032 level, more higher resistance can be located at the short-term 1.272 and 1.414 Fibonacci Extension levels (drawn in blue), priced at $0.03503 and $0.03689 respectively.
Resistance above this level can be expected at the bearish .382 Fibonacci Retracement level (not displayed on the chart) priced at $0.03930.
Where is the Support Located Below the Current Market Price?
If the sellers drive price action lower, we can expect immediate support at the short-term .382 Fibonacci Retracement level (drawn in green) priced at $0.02681.
If TRX/USD heads even further lower, then more support can be expected at the short-term .5 and .618 Fibonacci Retracement levels (drawn in green), priced at $0.02402 and $0.02122 respectively.
TRX/BTC Price
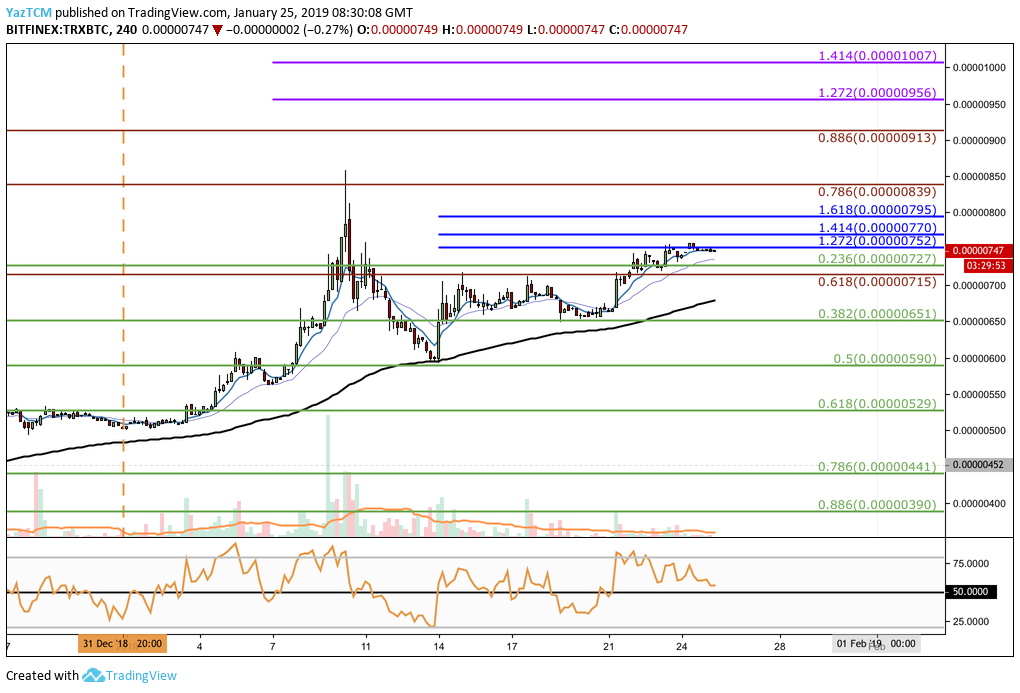
Looking at the 4-hour TRX/BTC chart above, we can see that price action has continued higher from the short-term .236 Fibonacci Retracement level and has reached resistance at a very short-term 1.272 Fibonacci Extension level (drawn in blue) priced at 752 SATS.
Trend: Bullish
The market is still in a bullish trading condition after the rise above 727 SATS.
For the bull run to continue, we will need to see price action break above the 752 SATS handle. For this trend to be considered bearish, price action needs to break below the 590 SATS handle.
Where is the Resistance Towards the Upside?
If the bulls can cause price action to climb above the resistance at 752 SATS, we can expect immediate higher resistance at the very short-term 1.414 and 1.618 Fibonacci Extension levels (drawn in blue), priced at 770 SATS and 795 SATS respectively.
If TRX/BTC breaks above the 800 SATS handle, there is more resistance at the bearish .786 and .886 Fibonacci Retracement levels (drawn in red), priced at 839 SATS and 913 SATS respectively.
Further resistance towards the upside can then be expected at the short-term 1.272 and 1.414 Fibonacci Extension levels (drawn in purple) priced at 956 SATS and 1,007 SATS, respectively.
Where is the Support Located Below the Market?
Alternatively, if the sellers start to push price action lower, we can expect immediate support beneath to be located at the short-term .236 and .382 Fibonacci Retracement levels (drawn in green), priced at 727 SATS and 651 SATS respectively.
Further support below this can be found at the short-term .5 and .618 Fibonacci Retracement levels (drawn in green), priced at 590 SATS and 529 SATS respectively.
Conclusion
For the bullish run to continue for TRX/USD, we need to see price action break above the $0.02739 handle. If TRX/BTC can break above 752 SATS and BTC/USD climbs higher, we can expect TRX/USD to continue to head higher as well.