
Latest TRON News
The price of TRON is benefiting from the announcement of BitTorrent launching their own token on the TRON blockchain. Justin Sun has come forward to state that he believes this recent announcement has the potential to spur blockchain mass adoption.
The BitTorrent Token along with BitTorrent Speed is slated to be launched at some time this summer. BitTorrent Speed is a service that will reward customers who continuously seed files to other users connected through their client.
TRX/USD Price Analysis
TRX has seen a 6.76% increase in price over the past 24 hours of trading, bringing the current trading price up to $0.02571, at the time of writing. The cryptocurrency has now seen a 22.42% price hike over the past 30 trading days.
TRON is ranked in 9th position as it currently holds a market cap value of $1.69 billion. The 16-month old project is now trading at a value that is 90% lower than its all-time high price.
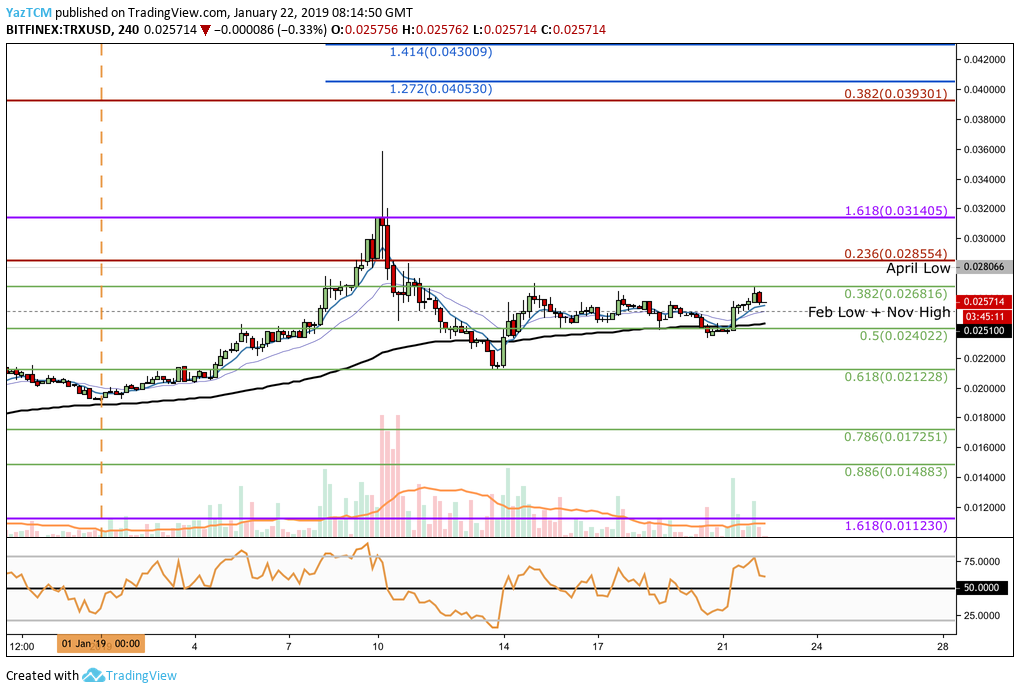
Analyzing price action for TRX/USD from the 4-hour perspective above, we can see that price action has now reached the upper boundary of the trading range, provided by resistance at the short-term .382 Fibonacci Retracement level (drawn in green) priced at $0.02681.
At the time of writing, price action has been rejected by the upper boundary and looks to be heading lower.
Trend: Neutral
The market is still trading within an established trading range, and therefore price action is neutral.
The current trading range is extremely narrow as the market is now bound between the short-term .382 and .5 FIbonacci Retracement levels (drawn in green) priced at $0.02681 and $0.02402, respectively.
For this market to be considered bullish in the short term, we would need to see price action break above $0.02681. The bears would be in control if we see price action break below $0.02128.
Where is the Support Located Below the Market?
If TRX/USD falls lower, we will see immediate support below at the lower boundary of the trading range at the short-term .5 Fibonacci Retracement level (drawn in green) priced at $0.02402.
Further support below this can then be located at the short-term .618 Fibonacci Retracement level (drawn in green) priced at $0.02122.
If the bears continue to drive price action below the $0.020 handle, further support beneath is at the short-term .786 and .886 Fibonacci Retracement levels (drawn in green), priced at $0.01725 and $0.01488 respectively.
The final level of support to highlight is located at the previous long-term downside 1.618 Fibonacci Extension level (drawn in purple) priced at $0.01123.
Where Will the Market Meet Resistance Towards the Upside?
If the buyers regroup and begin to push price action higher, we can expect immediate resistance above to be located at the short-term .382 Fibonacci Retracement level (drawn in green) priced at $0.02681.
If TRX/USD breaks above the upper boundary of the trading range, higher resistance can be located at the bearish .236 Fibonacci Retracement level (drawn in red) priced at $0.02855.
This is closely followed by more resistance above at the short-term 1.618 Fibonacci Extension level (drawn in purple) priced at $0.03140.
If the buyers can continue to drive price action even higher, more resistance towards the upside is located at the bearish .382 Fibonacci Retracement level (drawn in red) priced at $0.03930. There is also higher resistance at the short-term 1.272 and 1.414 Fibonacci Extension levels (drawn in blue), priced at $0.04053 and $0.043009 respectively.
TRX/BTC Price Analysis
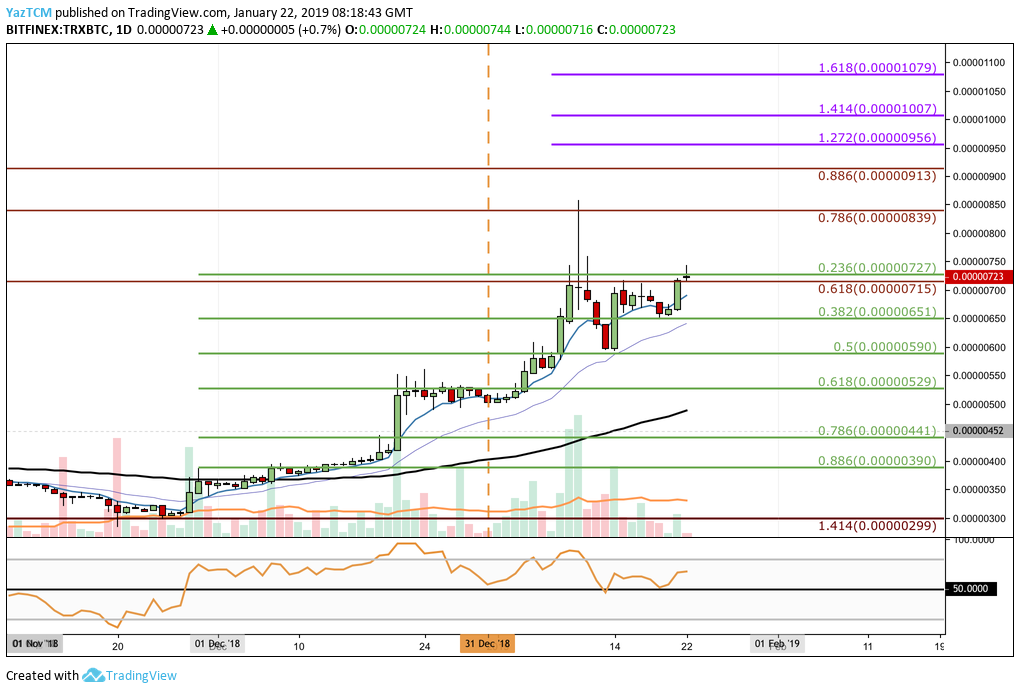
Taking a look at the TRX/BTC market from the daily chart above, we can see that the market had reversed at the downside 1.414 FIbonacci Extension level (drawn in red) priced at 299 SATS toward the end of November 2018.
It then began to surge significantly.
The market has surged by a total of around 145% from reversing to where is currently trading today, at the short-term .236 Fibonacci Retracement level (drawn in green) priced at 727 SATS.
Trend: Bullish
The current trend for TRX/BTC is undoubtedly bullish at this moment in time.
For this market to be considered bearish, we would need to see price action break below the 500 SATS handle.
Where is the Resistance Towards the Upside?
If price action goes higher, we can expect immediate resistance above to be located at the long-term bearish .786 and .886 FIbonacci Retracement levels (drawn in red), priced at 839 SATS and 913 SATS respectively.
This bearish FIbonacci Retracement is measured from the high of 1,011 SATS seen on May 26, 2018 to the low witnessed during November 2018.
If TRX/BTC breaks above the 913 handle, higher resistance can be expected at the short-term 1.272 and 1.414 Fibonacci Extension levels (drawn in purple), priced at 956 SATS and 1,007 SATS respectively.
The final level of resistance to highlight toward the upside is located at the short-term 1.618 FIbonacci Extension level (drawn in purple) priced at 1,079 SATS.
Where is the Support Located Beneath the Market?
If the sellers push price action below the support at 715 SATS, we can expect further support towards the downside at the short-term .382 and .5 Fibonacci Retracement levels (drawn in green), priced at 651 SATS and 590 SATS respectively.
Further support below this can then be expected at the short-term .618 and .786 Fibonacci Retracement levels (drawn in green), priced at 529 SATS and 441 SATS respectively.
Conclusion
The recent hype received from the BTT announcement has certainly caused TRX to rise significantly against BTC.
However, with the price of Bitcoin struggling, the TRX/USD market will need a significant push for the market to continue to climb higher at a similar rate.