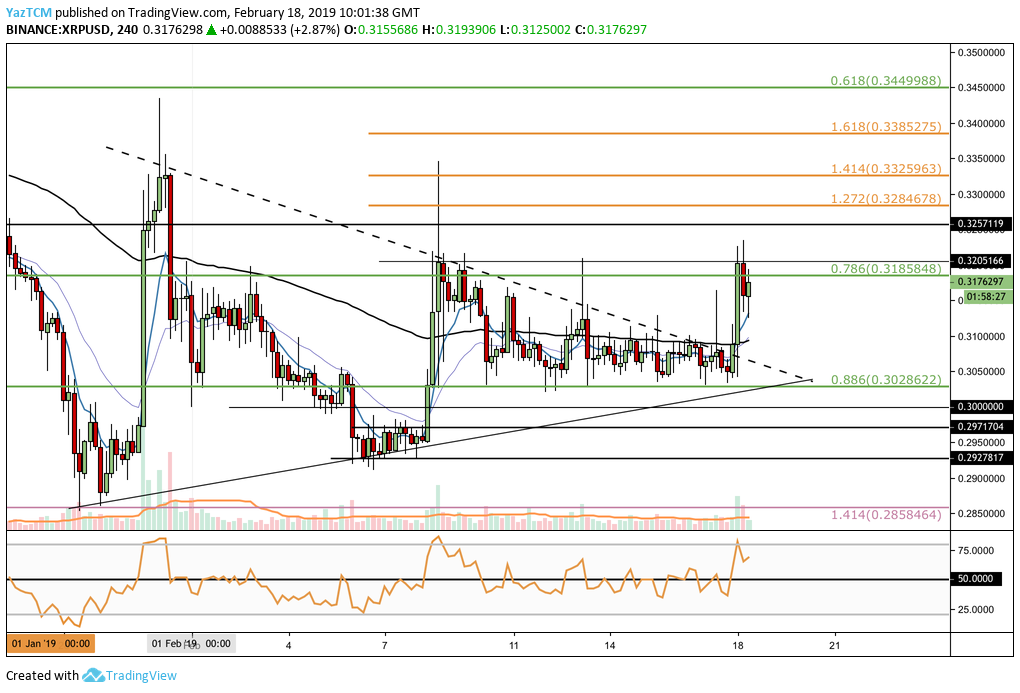
- Support for XRP moving forward: $0.31, $0.3028, $0.30, $0.2971, $0.2927, $0.2858.
- Resistance for XRP moving forward: $0.3185, $0.3205, $0.3257, $0.3284, $0.3325, $0.3385, $0.3449.
Ripple Price Analysis
The Ripple market has experienced a small price hike totaling 2.47% over the past 24 hours of trading, bringing the current price for the cryptocurrency up to $0.3176, at the time of writing.
Ripple continues to remain ranked in 3rd position as it presently holds a market cap value of $12.77 billion. The cryptocurrency still has a way to recover, having lost a considerable 39% over the past 90 trading days.
XRP/USD Price
Analysing XRP/USD from the 4HR perspective above, we can see that over the past 24 hours of trading, the market has broken out of the consolidation pattern previously identified in our last Ripple analysis.
XRP/USD penetrated above the upper boundary of the symmetrical triangle and continued to rise higher into previous resistance at the $0.3205 level. Price action was unable to overcome this level, at the time of writing, and has since dropped slightly slower to around $0.3176.
Trend: Neutral
Although the market may be bullish in the short term, we would still need to see a higher high in price action to confirm the overall trend is bullish. This would require a close above the $0.3350 level.
For this market to now be considered bearish, we would need to see price action break below the support at the $0.30 level.
Where is the Market Likely to Head Towards Next?
If the recently-established short-term bullish momentum can persist, we can expect XRP/USD to retest the $0.3205 handle soon.
If price action can break above this resistance level, then higher resistance above will be expected at the $0.3257 level, followed by further resistance at the short-term 1.272 and 1.414 Fibonacci Extension levels (drawn in orange), priced at $0.3284 and $0.3325 respectively.
If the buyers can continue to climb above the $0.3350 level, there is more resistance above located at the short-term 1.618 Fibonacci Extension level (drawn in orange) priced at $0.3385.
More resistance above the $0.34 level can then be located at the previous medium-term .618 Fibonacci Retracement level (drawn in green) priced at $0.3449.
What if the Sellers Resume Control?
Alternatively, if the sellers regroup and start to push XRP/USD lower again, we can expect immediate support beneath to be located at the $0.31 handle. This is followed by more support at the medium-term .886 Fibonacci Retracement level (drawn in green) priced at $0.3028.
Further support below is then expected at the $0.30 level. If the bears push price action below the $0.30 level, we can expect more support located at the $0.2971 and $0.2927 levels.
XRP/BTC Price
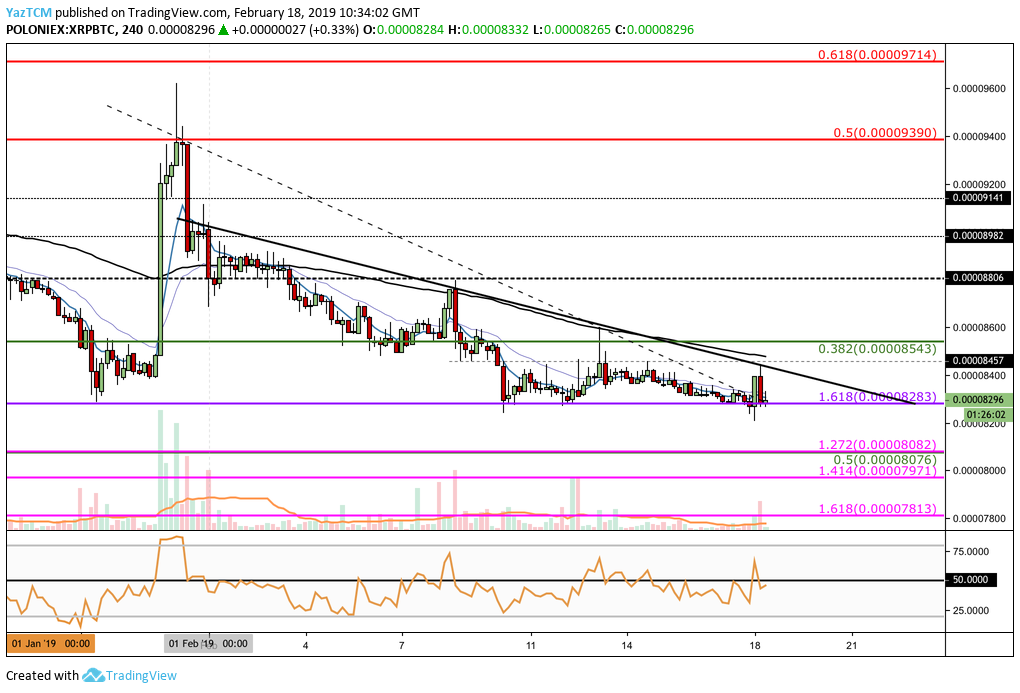
Taking a look at the 4HR XRP/BTC chart above, we can see that the market had broken above the previous descending triangle (dashed falling trend line) outlined in our previous analysis.
However, price action was unable to capitalize on this breakout and has now formed a new descending triangle characterized by the thick black falling line and the downside 1.618 Fibonacci Extension level (drawn in purple) priced at 8,283 SATS as the base.
XRP/BTC was turned away at the upper boundary of the new descending triangle and has now returned to support at the downside 1.618 FIbonacci Extension level (drawn in purple) priced at 8,283 SATS. This level has provided strong support for the market during January and February 2019.
Trend: Neutral
The trend remains neutral as it trades within the confines of the consolidation pattern highlighted. If XRP/BTC was to slip below the support at 8,283 SATS, we can consider the market bearish.
For this market to be considered bullish, we would need to see price action break above the 8,805 SATS handle to create a higher high.
Where is the Market Likely to Head Towards Next?
If the bulls can hold the support at 8,283 SATS and cause XRP/BTC to climb higher, we can expect immediate resistance above at the upper boundary of the descending triangle and then at the 8,547 SATS level.
Further resistance above this can then be expected at the short-term .382 Fibonacci Retracement level (drawn in green), priced at 8,543 SATS, followed by more support at 8,806 SATS.
If the buyers continue to break above the 9,000 SATS level, there is more resistance above located at the 9,141 SATS level. Further resistance can be found at the bearish .5 and .618 FIbonacci Retracement levels (drawn in red), priced at 9,390 SATS and 9,714 SATS.
What if the Sellers Regain Control?
Alternatively, if the bears manage to push the market below the base of descending triangle at the 8,283 SATS level, we can expect immediate support beneath at the short -erm downside 1.272 Fibonacci Extension level (drawn in pink) priced at 8,082 SATS.
This level of support is further bolstered by the short-term .5 Fibonacci Retracement level (drawn in green) priced in the same area.
If the XRP/BTC market slips below the 8,000 SATS level, more support beneath can be located at the short-term downside 1.414 and 1.618 FIbonacci Extension levels (drawn in pink), priced at 7,971 SATS and 7,813 SATS respectively.
Conclusion
The recent price increase in Bitcoin has helped XRP/USD break above the previous triangle that the market was trading within. XRP/USD will now need to continue to break above the resistance at the $0.3205 level to follow through with this momentum.
However, if XRP/BTC price action slips below the base of the triangle, we can expect this to cause XRP/USD to fall lower once again.


