Ripple Price Analysis
The Ripple market has remained relatively stable over the past week as price action drops by a small 3.30%, bringing the price of the token down to around $0.3068. However, the market is down significantly over the past 90 trading days losing a precipitous 36% over the stated period.
Ripple is still ranked in 3rd position as it currently holds a $12.47 billion market cap valuation. However, the coin is closing in on second place Ethereum as it only sits a small $320 million in market cap value behind the project.
XRP/USD Price
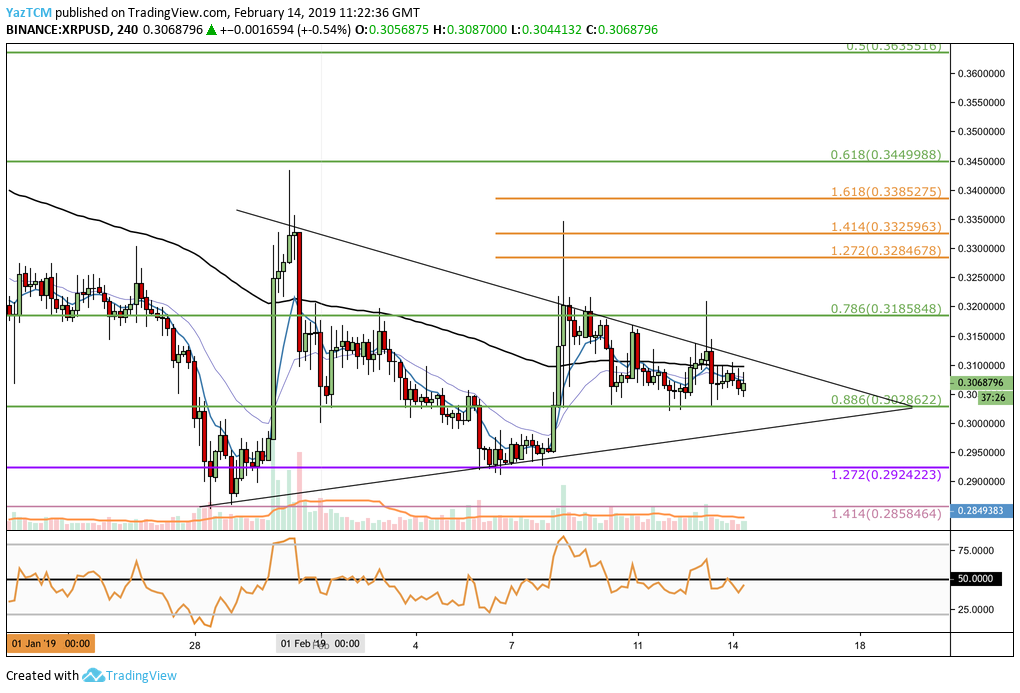
Since our last XRP/USD analysis, we can see that price action has continued to trade within the confines of the symmetrical triangle pattern previously highlighted. Price action has attempted to break above the upper boundary of the triangle throughout the week but had failed to do so as price action returned back underneath the consolidation pattern.
The market has managed to hold the support at the short-term .886 Fibonacci Retracement level (drawn in green) priced at $0.3028.
Trend: Neutral
As the market remains trapped within the consolidation pattern, the current market trend remains neutral.
If the market can break above the triangle and break above $0.34, we can consider the market as bullish. A break below the $0.30 handle and below the triangle would signal a bearish trend.
Where is the XRP/USD Market Likely to Head Towards Next?
The XRP/USD market has recently attempted to break above the upper boundary of the symmetrical triangle but had failed to follow through as price action returned back into the confines of the triangle.
If price action can hold above the short term .886 Fibonacci Retracement level (drawn in green) priced at $0.3028 and then can successfully break AND close above the upper boundary on the daily chart, we can expect immediate higher resistance at the short-term .786 Fibonacci Retracement level (drawn in green) priced at $0.3185.
If the buyers can then continue to climb above $0.32, there is more resistance above located at the short-term 1.272 and 1.414 (drawn in orange) price at $0.3284 and $0.3325. This is closely followed by resistance at the short-term 1.618 Fibonacci Extension level (drawn in orange) priced at $0.3385.
Resistance above the $0.34 handle can then be expected at the short-term .618 and .786 Fibonacci Retracement levels (drawn in green) priced at $0.3449 and $0.3635, respectively.
What if the Bears Push XRP Price Action Below The Support at $0.3028?
If the sellers manage to push the market below the support at the short-term .886 Fibonacci Retracement level (drawn in green) priced at $0.3028, we can expect immediate support below to be located at the lower boundary of the triangle.
If they proceed to push the market below the symmetrical triangle, there is more support located at the previous medium-term downside 1.272 FIbonacci Extension level (drawn in purple) priced at $0.2924.
XRP/BTC Price
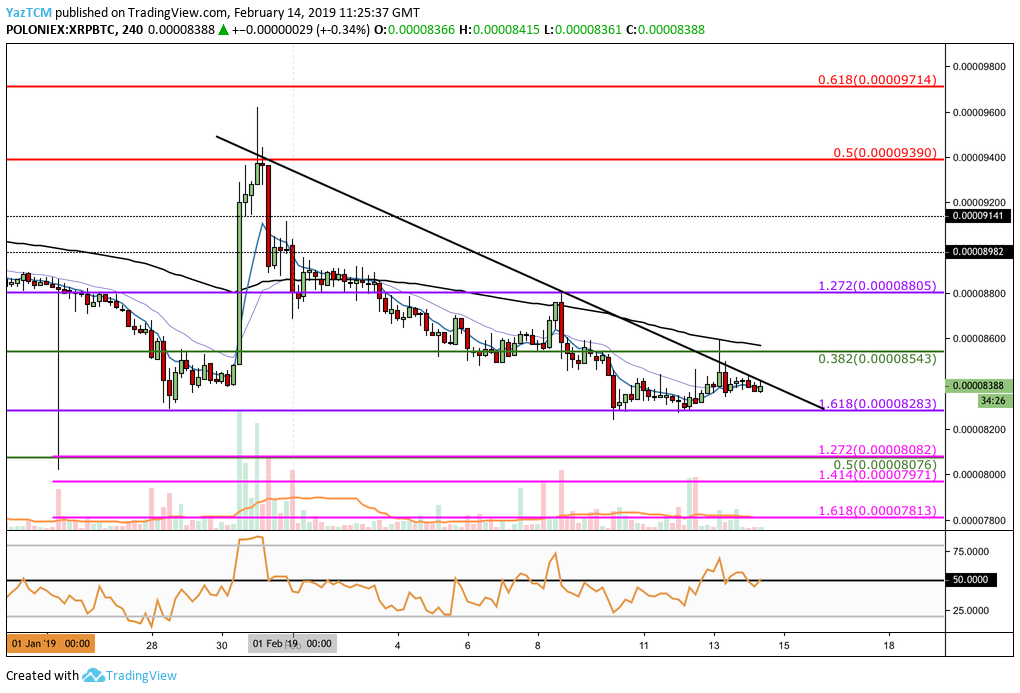
Since our last XRP/BTC analysis, we can see that price action has once again rebounded at the identified support at the medium-term downside 1.618 Fibonacci Extension level (drawn in purple) priced at 8,283 SATS.
The market has now established a descending triangle formation with the upper boundary characterized by the falling black trend line and the base of the triangle characterized by the support at the downside 1.618 FIbonacci Extension level (drawn in purple).
Trend: Neutral
The trend continues to remain neutral as it trades within the pattern formation. However, we expect this trend to change quite soon as the market approaches the apex of the triangle where a breakout is expected either towards the upside or downside.
If the market falls below the support at the 8,283 SATS handle, we can consider the trend bearish. For this market to be considered bullish, we would need to see price action rise and break above the 8,805 SATS handle.
Where is the XRP/BTC Market Likely to head Towards Next?
The market is likely to continue trading within the confines of the triangle until a breakout will occur close to the apex.
If the sellers push price action below the lower boundary of the triangle below 8,283 SATS, we can expect further support below located at the short-term 1.272 and 1.414 Fibonacci Extension levels (drawn in pink), priced at 8,082 SATS and 7,971 SATS. The support at 8,082 SATS is further bolstered by the short-term .5 Fibonacci Retracement level (drawn in green) priced in the same area, adding further to the expected support here.
Further support beneath 7,971 SATS can be expected at the short-term 1.618 Fibonacci Extension level (drawn in pink) priced at 7,813 SATS.
What if the Buyers Break Above the Triangle?
Alternatively, if the bulls cause price action for XRP/BTC to rise and break above the descending triangle, we can expect immediate resistance above at the short-term .382 Fibonacci Retracement level (drawn in green) priced at 8,543 SATS.
Further resistance is then expected at the previous medium-term downside 1.272 Fibonacci Extension level (drawn in purple) priced at 8,805 SATS, followed by resistance at the 8,982 SATS and 9,141 SATS levels.
If the buyers continue to travel higher above 9,200 SATS we can then expect higher resistance at the bearish .5 and .618 Fibonacci Retracement levels (drawn in red), priced at 9,390 SATS and 9,714 SATS respectively.
Conclusion
The resolution of the triangles, particularly the XRP/BTC triangle, will be the next important factor in deciding in which direction Ripple will travel next.
If XRP/BTC can break above its descending triangle and begin to climb higher, we can expect the XRP/USD market to follow suit and break above its symmetrical triangle at the same time.