- Support for XRP moving forward: $0.3028, $0.30, $0.2924, $0.2858.
- Resistance for XRP moving forward: $0.3150, $0.3185, $0.3284, $0.3325, $0.3385, $0.3449.
Ripple Price Analysis
The past 7 trading days has seen XRP increase by a small 1.20%, bringing the price up to around $0.3091, at the time of writing. The cryptocurrency has lost a total of 16% over the previous trading month, with a further 39% price plummet over the past 90 trading days.
Ripple has sunk into 3rd position after being overtaken by Ethereum today. Ripple currently holds a market cap value of $12.57 billion as the 66-month old project now trades at a value that is 91% lower than its all-time high price.
XRP/USD Price
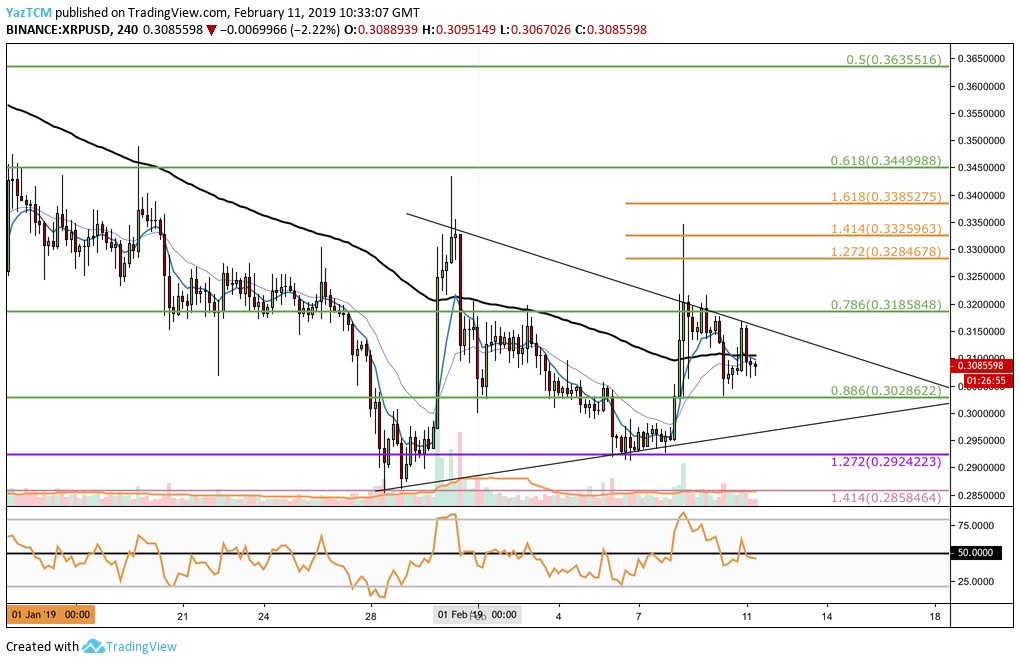
Analysing the 4HR XRP/USD chart above, we can see that since our last Ripple analysis, XRP has rebounded from our identified support at the medium-term downside 1.272 Fibonacci Extension level (drawn in purple) priced at $0.2924.
After the bounce, the market continued to rise until it reached resistance at the $0.32 handle which is slightly above the short-term .786 Fibonacci Retracement level (drawn in green) priced at $0.3185.
After reaching this area of resistance, price action rolled over and started to decline slowly. The price fall continued until support was met at the short-term .886 Fibonacci Retracement level (drawn in green) priced at $0.3028 which managed to prevent price action from falling further.
XRP/USD has now established a broad symmetrical triangle pattern in which price action is trading within as it consolidates.
Trend: Neutral
After rebounding and climbing back above the $0.30 handle, we can now assume that the trading condition for XRP/USD is neutral. If we see price action breaking below the lower boundary of the triangle and the $0.30 handle, we can consider the market bearish.
For this market to be considered bullish, we would need to see price action rise and break above the $0.34 handle.
Where is the Market Likely to Head Towards Next?
As the market is consolidating, we can expect price action to trade within the confines of the symmetrical triangle pattern until a breakout is seen in either direction.
If the bulls can continue their slow climb higher, we can expect immediate resistance above located at the upper boundary of the symmetrical triangle, around the $0.3150 handle. If price action breaks above the triangle, there is immediate higher resistance at the short-term .786 Fibonacci Retracement level (drawn in green) priced at $0.3185.
If the buyers climb above the $0.32 handle, there is further higher resistance at the short-term 1.272 and 1.414 Fibonacci Extension levels (drawn in orange), priced at $0.3284 and $0.3325 respectively. This is closely followed by resistance at the short-term 1.618 Fibonacci Extension level (drawn in orange) priced at $0.3385.
Further resistance towards the upside can then be expected at the short-term .618 and .5 Fibonacci Retracement levels (drawn in green) priced at $0.3449 and $0.3635, respectively.
What if the Sellers Begin to Push Price Action Lower?
If the sellers begin to pressure price action lower, we can expect immediate support below the market to initially be located at the short-term .886 Fibonacci Retracement level (drawn in green) priced at $0.3028. Further support beneath this will then be expected at the lower boundary of the symmetrical triangle.
If price action continues to fall beneath $0.30 and the lower boundary of the triangle, there is further support below at the medium-term downside 1.272 Fibonacci Extension level (drawn in purple) priced at $0.2924. More support below this can then be expected at the January 2019 price low at the longer-term downside 1.414 Fibonacci Extension level (drawn in lilac) priced at $0.2858.
Let us continue to take a look at XRP/BTC and highlight potential support and resistance moving forward.
XRP/BTC Price
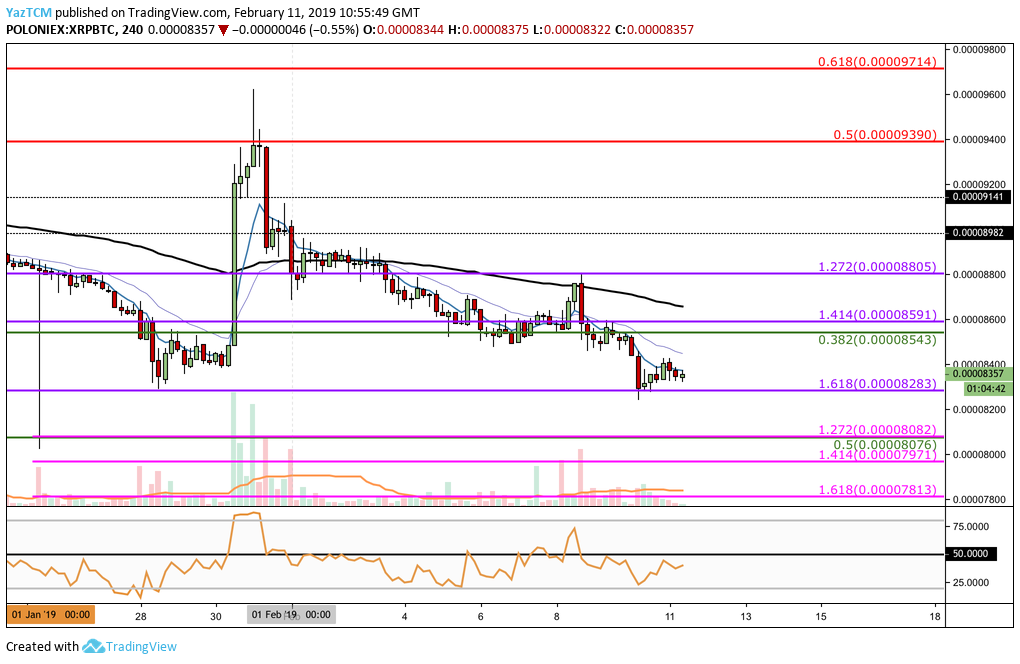
Since our last analysis, we can see that price action has proceeded to fall further below the support at the 8,543 SATS handle. The market fell until it recently reached support at the identified support at the medium-term downside 1.618 Fibonacci Extension level (drawn in purple) priced at 8,283 SATS.
Trend: Neutral
As price action has not yet dropped below the 8,283 SATS handle, the trading condition is still neutral. If price action does drop below this level, then the trend will be considered bearish.
For this market to be considered bullish, we would need to see price action break above the 8,805 SATS handle to create a higher high in February 2019.
Where is the Market Likely to Head Towards Next?
If XRP/BTC falls below the support at 8,283 SATS, we can expect immediate further support beneath to be located at the 8,200 SATS level.
This is immediately followed by further support at the short-term .5 Fibonacci Retracement level (drawn in green) priced at 8,076 SATS. This area of support is further bolstered by a short-term downside 1.272 Fibonacci Extension level (drawn in pink) priced within the same area.
If the market continues to break below 8,000 SATS, we can then expect further support beneath at the short-term downside 1.414 and 1.618 Fibonacci Extension levels (drawn in pink) priced at 7,971 SATS and 7,813 SATS, respectively.
What if the Bulls Regain Control of the XRP/BTC Market?
Alternatively, if the bulls regroup and start to push price action higher, they will meet immediate resistance above at the short-term .382 Fibonacci Retracement level (drawn in green) priced at 8,543 SATS.
This is immediately followed by more resistance at the medium-term downside 1.414 and 1.272 Fibonacci Extension levels (drawn in purple) priced at 8,591 SATS and 8,805 SATS, respectively.
Conclusion
Price action for XRP has been in a phase of consolidation recently as the market moves sideways between $0.32 and $0.29. As the rest of the altcoin markets surge, this has let Ethereum recently take over Ripple.
However, the market caps of both coins are very close and we can expect them to continue to switch positions over the next few days.
The symmetrical triangle will be important to watch as it will likely be the deciding factor as to which direction XRP price action will break out towards next.