Ripple Price Analysis
The last 7 trading days has been a troublesome period for Ripple holders as price action has dropped by a significant 8.86% over the period, bringing the current trading price down to around $0.2952, at the time of writing.
The cryptocurrency has now seen a 20% price drop over the past 30 days, with a further 42% price plummet over the past 90 trading days. Ripple currently holds a $12.02 billion market cap value which puts it in 2nd place in the market cap rankings.
XRP/USD Price
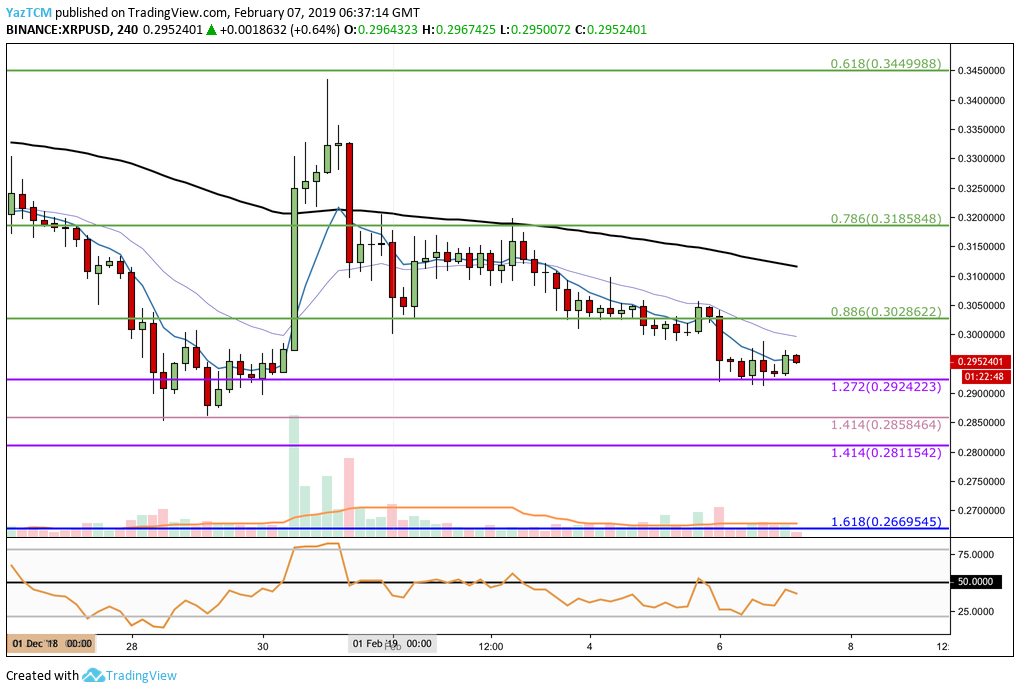
Taking a look at XRP/USD from the 4HR chart above, we can see that since our last analysis of XRP, price action declined past the identified support at the short-term .886 Fibonacci Retracement level (drawn in green) priced at $0.3028.
The price drop has seen Ripple fall below the $0.30 handle as it continued into support provided by the short-term downside 1.272 Fibonacci Extension level (drawn in purple) priced at $0.2924, where the market is currently trading.
Trend: Bearish
As price action had broken through the support level at $0.30, we can now assume that the market is trending in a bearish direction.
If XRP can manage to close and hold above $0.30, the trend will return to a neutral condition. For this market to be considered bullish, we would need to see price action climb and break above the $0.34 handle.
Where is the XRP/USD Market Likely to Head Towards Next?
If the sellers continue to push price action below support at the short-term downside 1.272 Fibonacci Extension level (drawn in purple) priced at $0.2924, we can then expect further immediate support at the medium-term downside 1.414 Fibonacci Extension level (drawn in lilac) priced at $0.2858.
This level had provided support for the market during the December 2018 decline and also in January 2019, and is therefore expected to provide strong support moving forward.
If the bears continue to cause XRP/USD to fall below this support at $0.2858, there is further support below at the short-term downside 1.414 FIbonacci Extension level (drawn in purple) priced at $0.2811.
If the selling pressure causes XRP/USD to fall below the $0.27 handle, more support beneath can be expected at the long-term downside 1.618 Fibonacci Extension level (drawn in blue) priced at $0.2669.
What if the Bulls Can Hold at $0.2858?
If price action falls into the support at $0.2858 but is defended by the bulls and XRP proceeds to climb higher again, we can expect immediate resistance above at the $0.2924 handle, followed by further resistance at $0.30.
If the buyers climb above $0.30, there is higher resistance at the short-term .996 and .786 Fibonacci Retracement levels (drawn in green) priced at $0.3028 and $0.3158, respectively.
If the bullish pressure continues to drive the market above the $0.34 handle, we can then expect higher resistance at the .618 Fibonacci Retracement level (drawn in green) priced at $0.3449.
XRP/BTC Price
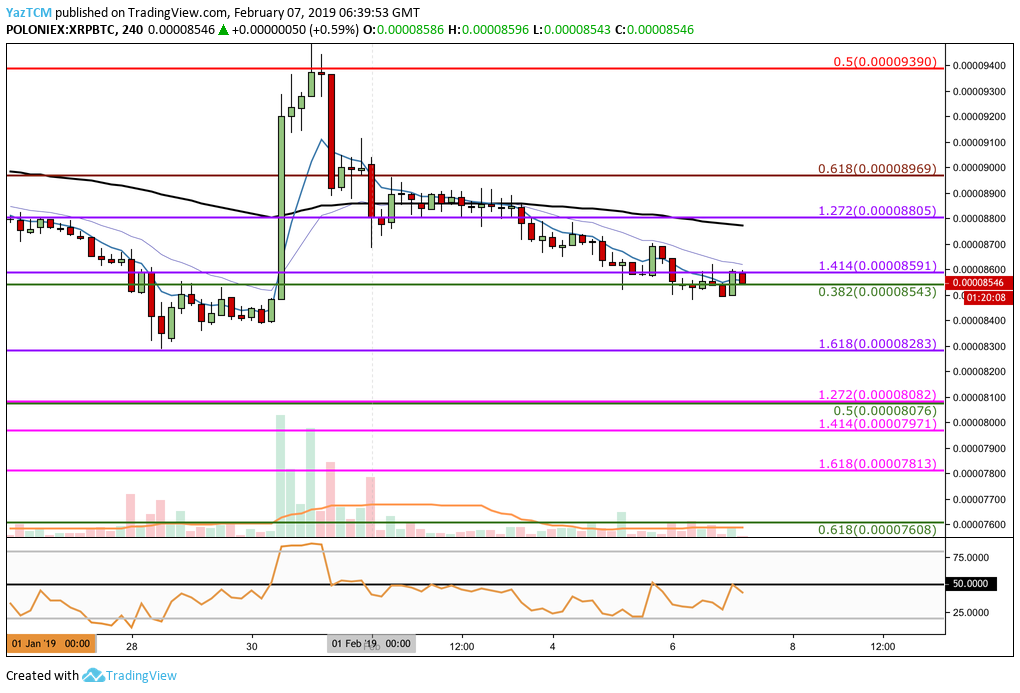
Taking a look at the 4HR chart for XRP/BTC above, we can see that since our last analysis the market has fallen further and penetrated below the medium-term downside 1.414 Fibonacci Extension level (drawn in purple) priced at 8,591 SATS.
Price action is now trading at support provided by the short-term .382 Fibonacci Retracement level (drawn in green) priced at 8,543 SATS but is expected to break below this level moving forward.
Trend: Neutral
The market is still in a neutral trading condition until price action can break below the January 2019 low at 8,283 SATS. For this market to be considered bullish, we would need to see price action rise and climb above the 9,390 SATS handle.
Where is the XRP/BTC Market Likely to Head Towards Next?
If the selling pressure continues and price action breaks below the 8,543 SATS handle, we can then expect more support below at the medium-term downside 1.618 Fibonacci Extension level (drawn in purple) priced at 8,283 SATS. This price level had provided support for the market during January 2019, and is expected to provide strong support for the market moving forward.
If price action continues to break below 8,283 SATS, there is further support below at the short-term .5 Fibonacci Retracement level (drawn in green) priced at 8,076 SATS. This support is further bolstered by a short-term downside 1.272 Fibonacci Extension level (drawn in pink) priced in the same region.
If the market breaks below 8,000 SATS, we can then expect more support below located at the short-term downside 1.414 and 1.618 Fibonacci Extension levels (drawn in pink), priced at 7,971 SATS and 7,813 SATS respectively.
What if the Bulls Hold at 8,283 SATS?
If the bulls can hold the support at 8,283 SATS and begin to climb higher, initial resistance above will be located at the medium-term downside 1.414 Fibonacci Extension level (drawn in purple) priced at 8,591 SATS.
Further resistance above 8,591 SATS can be expected at the medium-term downside 1.272 Fibonacci Extension level (drawn in purple) priced at 8,805 SATS, followed by more resistance at the 9,000 SATS handle.
Conclusion
The recent break below the $0.30 support level will leave many investors nervous about how much further the XRP/USD market may decline.
Providing that the $0.2858 region can hold, then the majority of investors will feel comfortable moving forward. However, if the market does break below the support at $0.2858, then we could see price action heading much further lower as it creates fresh 2019 price lows.