- Support for XRP moving forward: $0.3028, $0.2989, $0.2858, $0.2811, $0.2669.
- Resistance for XRP moving forward: $0.3106, $0.3185, $0.3291, $0.3361, $0.34, $0.3449.
Ripple Price Analysis
Ripple has seen a small 2% price drop over the past 24 hours of trading as the cryptocurrency now trades around $0.3028, at the time of writing. The market has now seen a price slide totaling 15% over the past 30 trading days.
Ripple continues to hold the second position as it retains a $12.42 billion market cap valuation. XRP has seen a 34% price fall over the past 90 trading days as the 66-month old project now trades at a value that is 91% lower than the all-time high price.
XRP/USD Price
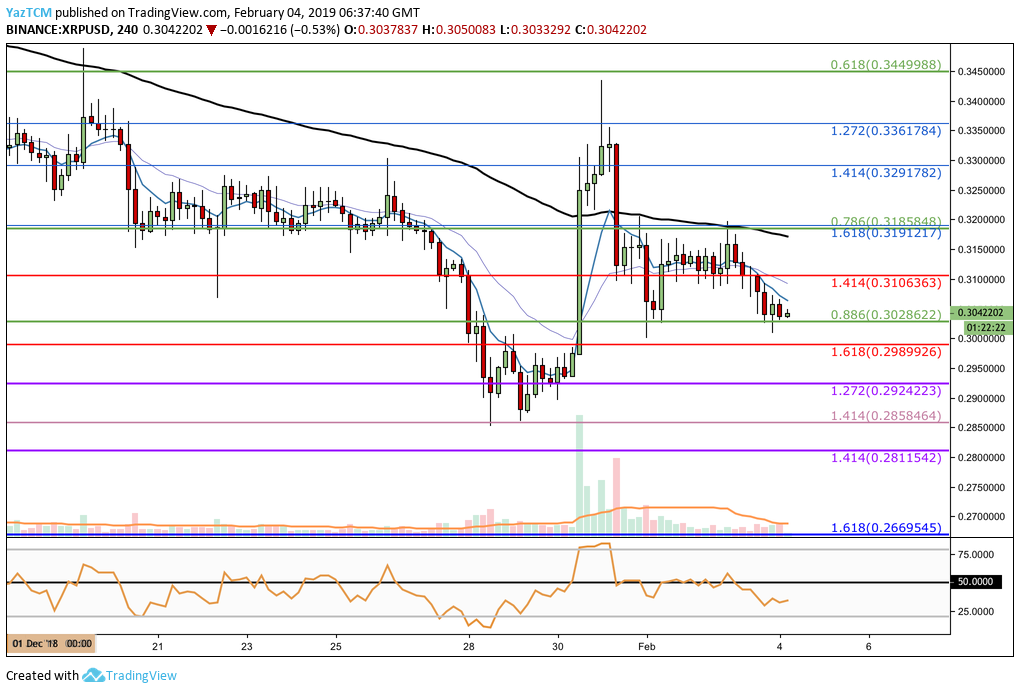
Since our last XRP/USD analysis, we can see that price action continued to decline over the following few days. The market broke below support at the short-term downside 1.414 Fibonacci Extension level (drawn in red) priced at $0.3106.
Price action continued to decline but managed to find support at the short-term .886 Fibonacci Retracement level (drawn in green) priced at $0.3028, where the market is now currently trading.
Trend: Neutral
The trend continues remain neutral as price action has managed to sustain itself above the $0.30 handle.
If price action breaks below $0.30, the trend will be considered bearish. For the trend to be considered bullish, the market must break above the $0.34 handle.
Where is the Market Likely to Head Toward Next?
If the buyers can continue to maintain price action above the $0.30 handle and begin to push higher, we can expect higher resistance to be located at the previous short-term downside 1.414 Fibonacci Extension level (drawn in red) priced at $0.3106.
This is closely followed with more resistance at the short-term .786 Fibonacci Retracement level (drawn in green) priced at $0.3185. Over the past few days, XRP/USD has struggled to overcome this level so significant momentum will be required to break above.
If the bulls can continue higher above $0.32, then higher resistance will be located at the previous downside 1.414 and 1.272 Fibonacci Extension levels (drawn in blue) priced at $0.3291 and $0.3361, respectively.
If price action can then climb above the $0.34 handle, more resistance above can be found at the short-term .618 Fibonacci Retracement level (drawn in green) priced at $0.3449.
What if the Market Breaks Below the $0.30 Handle?
If the sellers continue to increase their pressure and push price action below the $0.30 handle, we can expect immediate support below to be located at the short-term downside 1.618 Fibonacci Extension level (drawn in red) priced at $0.2989.
This is followed by more support below at another different short-term downside 1.272 Fibonacci Extension level (drawn in purple) priced at $0.2924.
Strong support below the $0.2924 handle is expected at the previous long-term downside 1.414 Fibonacci Extension level (drawn in lilac) priced at $0.2858. This price level had provided enough support to cause the 2018 price decline to reverse, and therefore is expected to provide strong support heading forward.
XRP/BTC Price
Taking a look at the 4HR chart above for XRP/BTC, we can see that since our last analysis the market has continued to decline.
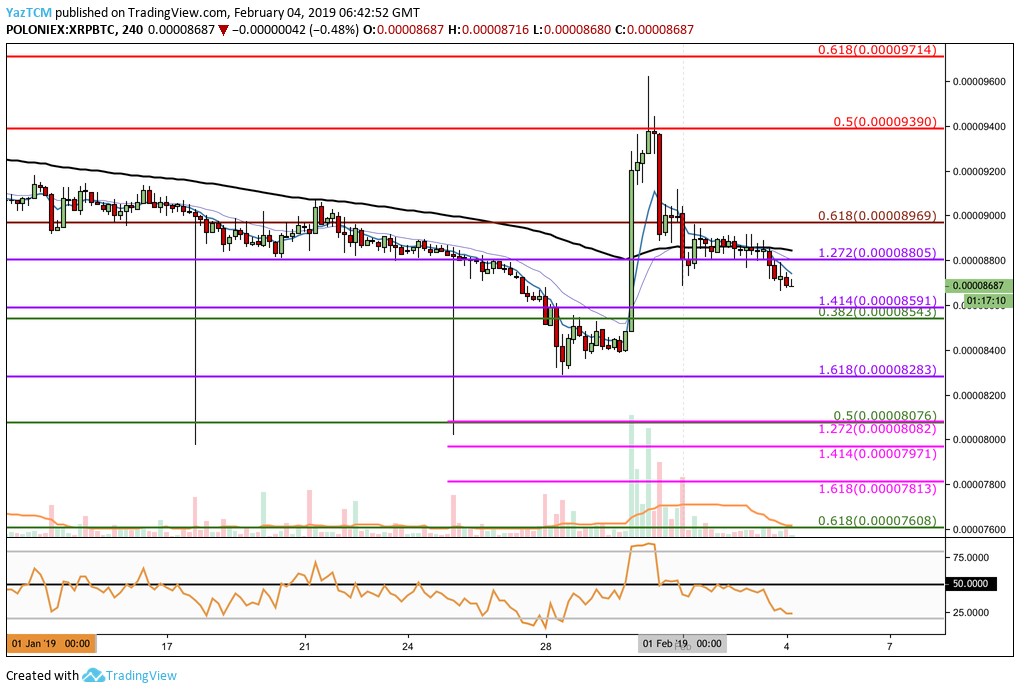
Price action had managed to remain relatively stable at the medium-term downside 1.272 Fibonacci Extension level (drawn in purple) priced at 8,805 SATS for a few days but has recently broken below this area of support as it trades around the 8,687 SATS handle.
Trend: Neutral
The market is still considered to be neutral until price action breaks below the 8,283 SATS handle. For this market to be considered bullish, price action would have to break above 9,390 SATS.
Where is the Market Likely to Head Towards Next?
As the market has recently broken below support, we can expect price action to continue to fall further lower.
Initial support below can be expected at the medium-term downside 1.414 Fibonacci Extension level (drawn in purple) priced at 8,591 SATS. This is closely followed up with more support at the short-term .382 Fibonacci Retracement level (drawn in green) priced at 8,543 SATS.
If the sellers continue to pressure price action below the 8,500 SATS handle, we can expect more support to then be located at the medium-term downside 1.618 Fibonacci Extension level (drawn in purple) priced at 8,283 SATS.
If price action continues to head below the January 2019 low at 8,283 SATS, there is more support located at the short-term .5 Fibonacci Retracement level (drawn in green) priced at 8,076 SATS. This is followed up with more support at the short-term downside 1.414 and 1.618 Fibonacci Extension levels (drawn in pink) priced at 7,971 SATS and 7,813 SATS, respectively.
The final level of support to highlight is located at the short-term .618 Fibonacci Retracement level (drawn in green) priced at 7,608 SATS.
What if the Bulls Push XRP/BTC Price Action Higher?
Alternatively, if the bulls can reverse the downtrend and begin to push price action higher, they will meet resistance immediately at the medium-term downside 1.272 Fibonacci Extension level (drawn in purple) priced at 8,805 SATS, followed by more resistance at the long-term .618 Fibonacci Retracement level (drawn in dark red) priced at 8,969 SATS.
If the buyers can cause XRP/BTC to climb above the 9,000 SATS handle, we can then expect more resistance above at the bearish .5 and .618 Fibonacci Retracement levels (drawn in red) priced at 9,390 SATS and 9,714 SATS, respectively.
Conclusion
The $0.30 handle will be an important level in deciding which direction the market will head toward next.
A break below may cause XRP price action to slip significantly lower as it heads toward $0.28. However, if the bulls can recover and push the market higher, then Ripple may be able to continue to climb higher back toward $0.34.