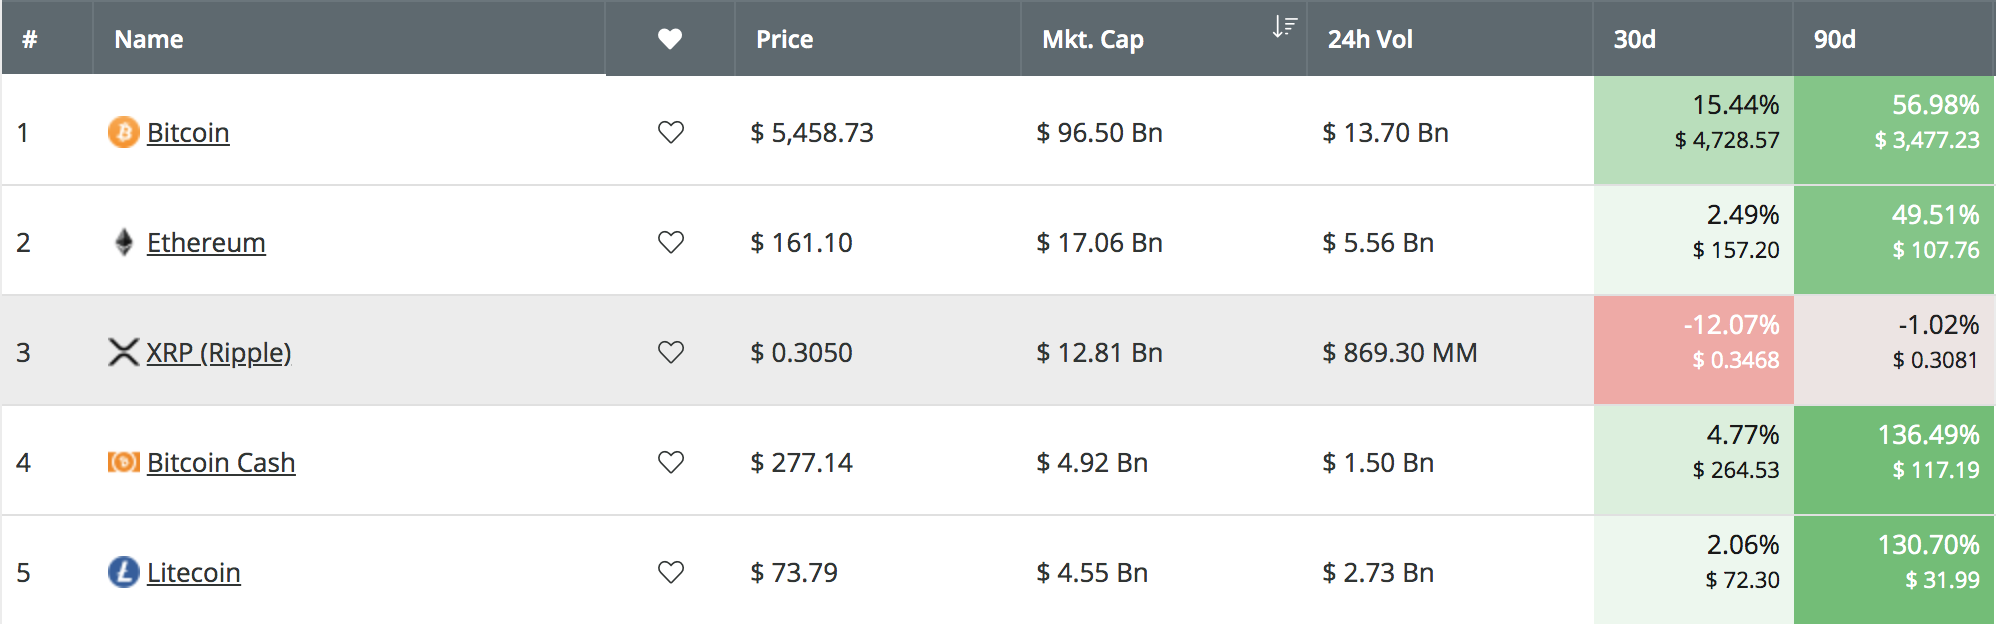
Over the past 3 months, Ripple has been trapped within a lifeless trading condition as price action has only managed to move by a total of -1%. In comparison, the rest of the top 5 coins have seen price increases that total over 50% over the past 90 trading days. Bitcoin Cash (BCH) and Litecoin (LTC) have both seen significant price surges totaling over 130% each.
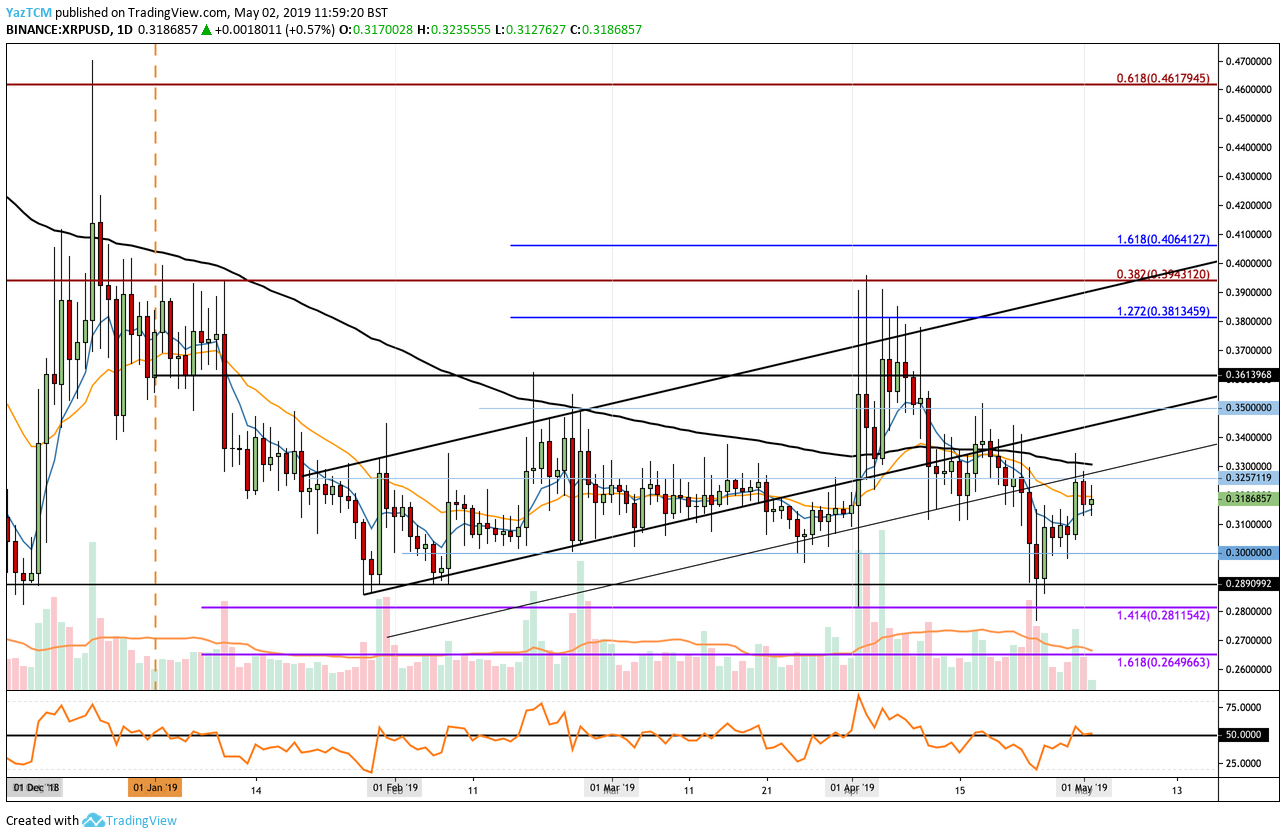
Ripple’s XRP managed to surge at the start of April 2019, reaching a high of around $0.3950. However, after reaching this high, the coin reversed and started to fall quickly. Ripple has now seen a price fall of 12% over the past 30 trading days, as the coin is currently trading at a price of around $0.3048. The market dropped a significant 30% from its high of $0.3950 to a low during April 2019, after reaching a low of $0.2765 on April 25.
Despite the long-term static trading condition, Ripple has managed to remain in 3rd position amongst the top cryptocurrency projects by market cap value. Ripple presently holds a $12.80 billion market cap, as it sits a comfortable $7.8 billion ahead of 4th position holder, Bitcoin Cash. However, the gap between Ripple and Ethereum is widening, as Ethereum has a market cap value that is $4.28 billion ahead of Ripple.
In this article, we will take a look at the potential for Ripple to rise by 25% in May 2019 and hit the $0.40 level. In April 2019, we wrote an article predicting whether Ripple might hit the same target, and price action came very close in April, reaching a high of $0.3958 on April 3. This was largely due to Bitcoin’s surge, which helped Ripple come close to the $.40 target. Nevertheless, the target value remains the same a month later, as we aim for a 25% increase in May if the market turns bullish.
Let us take a look at the XRP/USD market and highlight some areas of resistance for the bulls before being able to reach the $0.40 level.
Ripple Price Analysis
XRP/USD – SHORT TERM – DAILY CHART
What Has Been Going On?
During April 2019, the market managed to surge and reach a high above $0.3950. However, we can see the market had reached the highlighted resistance at a long-term bearish .382 Fibonacci Retracement level (drawn in red), priced at $0.3943. This bearish Fibonacci Retracement level is measured from the November 2018 high to the December 2018 low.
After reversing at this level of resistance, XRP/USD went on to fall throughout the month. During mid-April, price action fell beneath the 100-day moving average as the market turned bearish and continued to fall further lower into support at the $0.2890 level. The support at $0.2890 provided strong support for the market during December 2018, January 2019, and February 2019, and is considered an important level of support moving forward.
Ripple has somewhat recovered slightly after breaking back above the $0.30 level to rise to where it is currently trading around the $0.3186 level.
What Is the Short-Term Trend For XRP/USD?
The current short-term trend is neutral as the market continues to trade sideways. For this market to be considered bullish, we would need the bulls to at least break above the 100-day moving average level, which currently hovers around $0.33.
If the market was to drop beneath the previous support at around $0.2890, we could see some further fresh lows for XRP/USD during May 2019.
Where Is the Resistance On the Way Up to $0.40?
If the bulls manage to group up and start to begin a bullish wave higher, we can expect immediate resistance above the market to be located between $0.3250 and at $0.33, which is significantly bolstered by the 100-day moving average level.
Above the 100-day moving average level, we can expect higher resistance to be located at $0.34, $0.35, and $0.37. If the buyers can continue to drive XRP/USD above $0.37, the market will need to break above higher resistance, located at $0.3813 and $0.3943, before being clear to reach the target at $0.40.
What Are the Technical Indicators Showing?
After falling beneath the 50 level and reaching an oversold condition in April 2019, the RSI has now managed to return to the 50 level and break slightly above. This indicates the bulls may be ready to take control of the market momentum if they can continue to push the RSI above the 50 level.
The break above the 100-day moving average level will be a crucial pivotal resistance level for the market to overcome to turn bullish in May 2019.
Conclusion
Ripple has been trading within a dormant trading condition over the past 3 trading months. However, after reaching support at around $0.2890, the bulls have started to show their presence once again within the XRP/USD market. If the buyers can continue to allow the momentum to build, we can expect Ripple to increase by 25% and make a close attempt at the $0.40 target once again in May 2019.