
Ripple has seen a month riddled with sideways movements during March 2019 where the coin had lost a total of 5.51%. The cryptocurrency had been trading between the $0.33 and $0.30 price range and had remained between these two levels for the entire month.
Toward the end of the month, we saw Ripple falling below a 2 month long ascending price channel and drop to a low of $0.30. The market has somewhat recovered slightly and has managed to break back above the $0.31 level as it now is set to make an attempt back above $0.32.
Ripple is currently ranked in 3rd position as it holds a $12.99 billion market cap valuation. The 68-month-old project has suffered during 2019 as the market has dropped by a total of 21% since the start of the year.
In this article, we will take a look at the potential for Ripple to rise by 26%, in April 2019, and hit the $0.40 level. The $0.40 level contains significant resistance particularly because this is close to the 2019 price high.
Let us take a look at the XRP/USD market and highlight some areas of resistance for the bulls before being able to reach the $0.40 level.
Ripple Price Analysis
XRP/USD – SHORT TERM – DAILY CHART
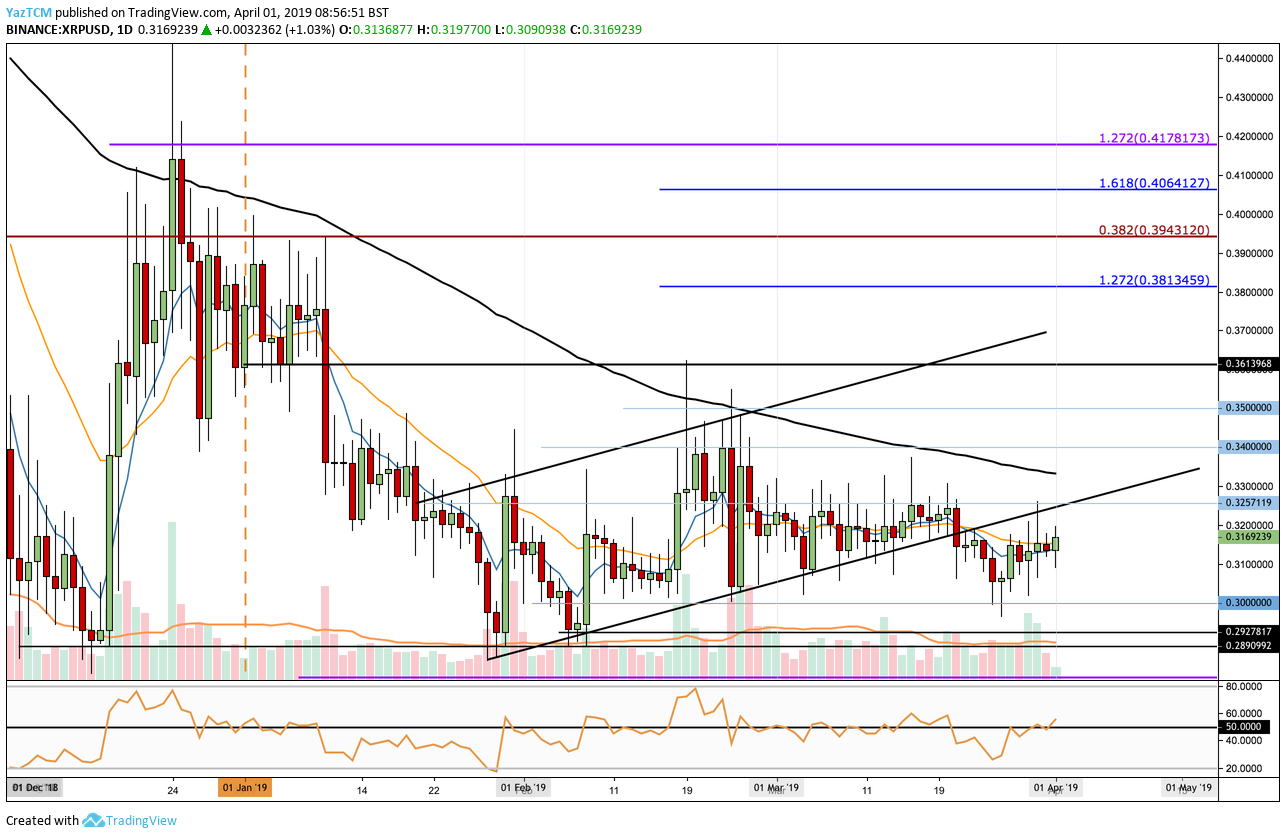
What Has Been Going On?
We can see that during January 2019 the market began to fall precipitously from a high around $0.40 to a low of $0.2890, which is also the December 2019 price low. After reaching the low the market began to slowly grind higher during February 2019, as price action started to trade within the confines of an ascending price channel.
As March 2019 started to trade we can see that Ripple struggled to make any movement above the $0.33 level. The market had traded sideways for the entire month which had eventually caused price action to drop out of the previous ascending price channel.
What Is The Short Term Trend For XRP/USD?
The current short term trend is neutral as the market continues to trade sideways. For this market to be considered bullish we would need to see price action break above the $0.33 level to create a higher high. IF we would like to see XRP rise by a total of 26% during April 2019 we would need to see XRP/USD clear the $0.33 level.
Where Is The Resistance On The Way Up To $0.40?
The first level of strong resistance for the bulls is located at the aforementioned $0.33 level. This area of resistance proved to be difficult to overcome during March 2019 and it is now further bolstered by the 100 day moving average which currently floats at the same level.
Above $0.33 we can then expect higher resistance at $0.34, $0.35, and $0.3613. If the bullish pressure continues to drive the market further higher, more resistance will then be located at the upper boundary of the previous ascending price channel.
Before being clear to tackle the $0.40 level the buyers will have to break above resistance at a short term 1.272 Fibonacci Extension level (drawn in blue) priced at $0.3813. The last level of strong resistance before $0.40 is then located at the bearish .382 Fibonacci Retracement level (drawn in red) priced at $0.3943. This bearish Fibonacci Retracement level is measured from the November 2018 high to the December 2018 low.
What Are The Technical Indicators Showing?
The RSI has recently penetrated above the 50 level which indicates that the bulls have started to regain control of the market momentum. If we would like to see XRP/USD breaking above the resistance at $0.33 we will need the RSI to remain above the 50 level and continue to climb further higher.
Conclusion
With the slight uptick in recent volume and the increased bullish momentum Ripple most certainly has the potential to make a test of the $0.40 region in April 2019. However, the market will first need to break above the month-long resistance at the $0.33 level. Above this the buyers should be pretty clear on the way up toward $0.40 until reaching further strong resistance at the $0.3943 level.