
Stellar Lumens has witnessed a small 2% price decline over the past 24 hours of trading. The cryptocurrency is currently exchanging hands at a price around $0.2552 after XLM saw a further 2.79% price drop over the past 7 trading days.
Stellar, the cryptocurrency that forked originally from Ripple, has continued to garner attention from the masses as they officially launch their StellarX exchange.
The StellarX exchange is a cryptocurrency exchange that offers a completely free trading experience. There are no trading fees, no blockchain fees and StellarX will not leverage the unused funds of their customers. The StellarX exchange will also present the ability to directly buy cryptocurrency with fiat money through its US Dollar onramps.
StellarX is the first product to be released from the recently merged company now called Interstellar. Interstellar was formed when the Stellar company called Lightyear acquired the blockchain company, Chain.
Lightyear, a company formed by XLM founder Jed McCaleb, is the commercial entity branch of Stellar. It focuses on helping institutions and enterprises integrate blockchain technology into their systems. Chain is similar to Lightyear as it also helps to onboard enterprises to blockchain technologies.
The merger is a significant one for Stellar as products developed by Chain have already been used by powerful companies such as Visa, Nasdaq and Citigroup.
Stellar is currently ranked 6th in terms of overall market cap across the entire industry. It currently holds a total market cap value of $4.8 billion after the 50-month old cryptocurrency saw a 21.84% price increase over the past 90 trading days. Stellar is currently trading at a price that is 70% lower than its all-time high price.
Let us continue to analyze price action for Stellar over the long term.
Stellar Price Analysis
XLM/USD – LONG TERM – DAILY CHART
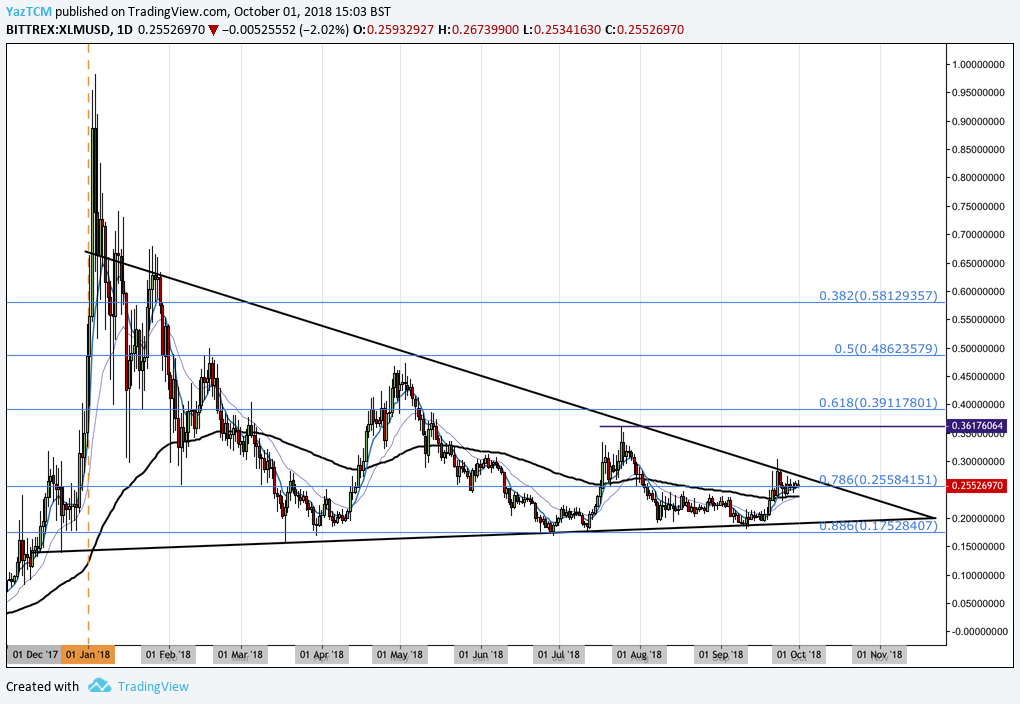
Analyzing the market from the long-term perspective above, we can see that XLM had experienced a significant bullish run toward the end of 2017. Price action started at a low of $0.0823 on December 8, 2017 and extended to an all-time high priced at $0.98239 on January 4, 2018. This was a price increase totaling over 1,100% from low to high.
After placing the all-time high price, we can see that price action rolled over and began to decline. It had originally found support at the .618 FIbonacci Retracement level priced at $0.3911 during January 2018. This Fibonacci Retracement is measured from the entire bullish run outlined above.
Price action continue to decline as the year progressed. The market had found a yearly low just below the .886 Fibonacci Retracement level priced around $0.1752 during March 2018. After the market found this support, it began to rally and price action did not return to this low again throughout the year.
We can see that as the year has developed, the market has established a long-term symmetrical triangle. Typically, a symmetrical triangle will resolve itself in the direction of the previous trend, in this case a bullish upside break. Price action is rapidly approaching the apex of the symmetrical triangle where a breakout is likely to happen, causing analysts and traders alike to remain focused, waiting for price action to breakout from the technical pattern.
Let us continue to analyze price action a little closer over the short term and highlight any potential support and resistance zones.
XLM/USD – SHORT TERM – DAILY CHART
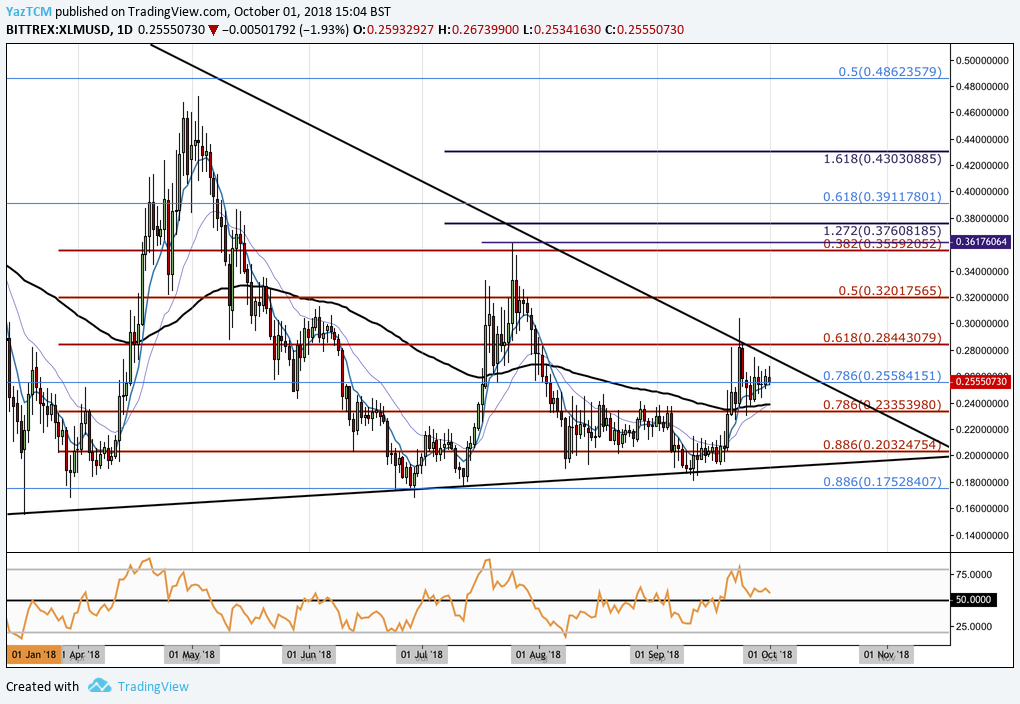
Analyzing price action from the perspective of a shorter time horizon, we can see that the market had experienced another smaller bullish run when price action started from a low of $0.16796 on March 30, 2018 and extended to an intermediary high of $0.4677 on April 29, 2018. This was a price increase totaling over 175% from low to high.
After placing the high, the market rolled over and began to decline. We can see that price action continued to decline until hitting the long-term support level at the .886 Fibonacci Retracement level (drawn in blue) priced at $0.17528 during June 2018. This level also contained the long-term upward sloping trend line, forming the lower boundary of the symmetrical triangle and adding further to the level of support in this area.
Price action is now trading directly on the long-term .786 Fibonacci Retracement level (drawn in blue) priced at $0.25584. Price action had attempted to penetrate above the upper boundary of the symmetrical triangle during the latter stages of trading in September but failed to break above each time.
Moving forward, if the bears re-enter the market from this price level and push price action lower, we can expect immediate support below to be located at the short-term .786 Fibonacci Retracement level (drawn in red) priced at $0.02335. This area of support is significantly bolstered due to the 100-day moving average hovering closely to this price area.
If the bears continue to push price action even lower, then more support can be located at the short-term .886 Fibonacci Retracement level priced at $0.2032, followed by the lower boundary of the symmetrical triangle.
Alternatively, if the bulls regather momentum at $0.2558 and push price action higher, we can expect immediate resistance above to be located at the upper boundary of the symmetrical triangle. A break above the triangle would signal to the majority of traders that a bull run is potentially incoming, thereby making a break above the triangle a self-fulfilling event as more traders decide to buy.
Immediate resistance above the triangle can be expected at the short-term .618 Fibonacci Retracement level (drawn in red) priced at $0.2844.
Further resistance above can then be expected at the short-term .5 and .382 Fibonacci Retracement levels (drawn in red) priced at $0.3201 and $0.3559, respectively. If the bullish wave continues even further higher, then more resistance can then be expected at the short-term 1.272 Fibonacci Extension level priced at $0.3760, followed by the long term .618 Fibonacci Retracement level priced at $0.3911.
The technical indicators within the market are currently favoring the bulls at this moment in time, as the RSI trades above the 50 handle. However, RSI is declining as it approaches the 50 handle which may indicate that the previous bullish momentum is beginning to fade.
So long as the RSI remains above 50, we can expect the market to continue to make further gains.
Let us continue to quickly analyze price action for XLM relative to BTC over the long run and highlight any potential support and resistance areas.
XLM/BTC – LONG TERM – DAILY CHART
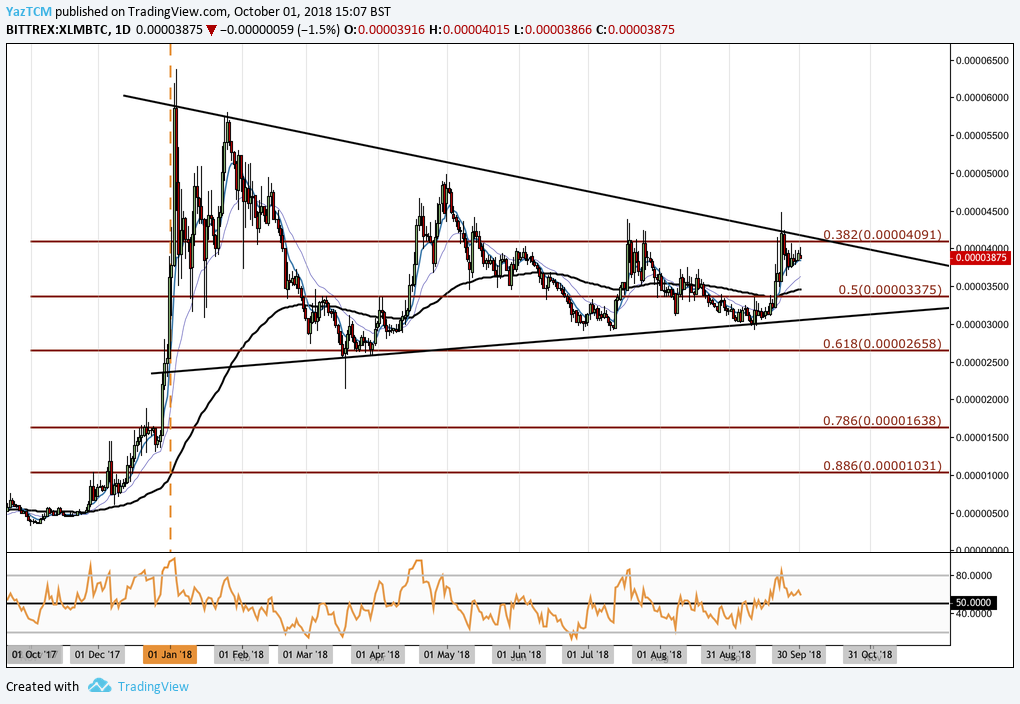
Analyzing the market relative to BTC, we can see that XLM had experienced a significant bullish run when price action started from a low of 358 SATS on November 4, 2017 and extended to an all-time high price of 6,370 SATS on January 4, 2018. This was a price increase totaling 1,800% from low to high.
After hitting the all-time high, price action rolled over and began to decline. We can see that the market had found some significant support at the .618 Fibonacci Retracement level priced at 2,658 SATS during March 2018. This area of support proved significant as the market did not return to these lows during the rest of the year.
We can also see that price action has been establishing a symmetrical triangle within this market, although it is not as clearly defined. Price action is now trading at 3,875 SATS as the market prepares itself for another test of the upper boundary of the symmetrical triangle.
If the bulls do push price action higher, we expect immediate significant resistance to be located at the .382 Fibonacci Retracement level priced at 4,091 SATS. This area of resistance will be significant as this also contains the upper boundary of the triangle.
Alternatively, if the bears regather momentum and push price action lower, we can expect immediate support to be located at the .5 Fibonacci Retracement level priced at 3,375 SATS, followed by the lower boundary of the symmetrical triangle.
Related: Stellar Achieves Milestone of 1 Million Active Accounts