
Wanchain has experienced a promising price hike this week after months of declining prices. Wanchain saw a 32% increase over the past 7 trading days as the cryptocurrency currently is exchanging hands at around $0.82. This price increase comes after Wanchain sees a precipitous 61% price drop over the past 30 trading days.
Wanchain has a vision to rebuild finance. With the rapidly increasing number of ICOs and projects, the number of tokens has equally increased. However, all of these coins still have no means of communicating and exchanging with one another without the need to go through a centralized exchange. Wanchain intends to fix this problem through its cross chain communication protocol.
The 5-month old cryptocurrency will allow differing blockchains to connect with one another allowing a means of exchange without the need to use a 3rd party service. This should greatly increase the access to cryptocurrency for those who struggle registering with cryptocurrency exchanges as well as greatly reducing the risk of crypto exchange thefts.
Wanchain is currently ranked 71st in terms of overall market cap across the entire industry. It has a total market cap value of $88 million after suffering a 83% price drop over the past 90 trading days.
Let us continue to analyze price action for WanChain over its short life span.
Price Analysis
WAN/USD – MEDIUM TERM – DAILY CHART
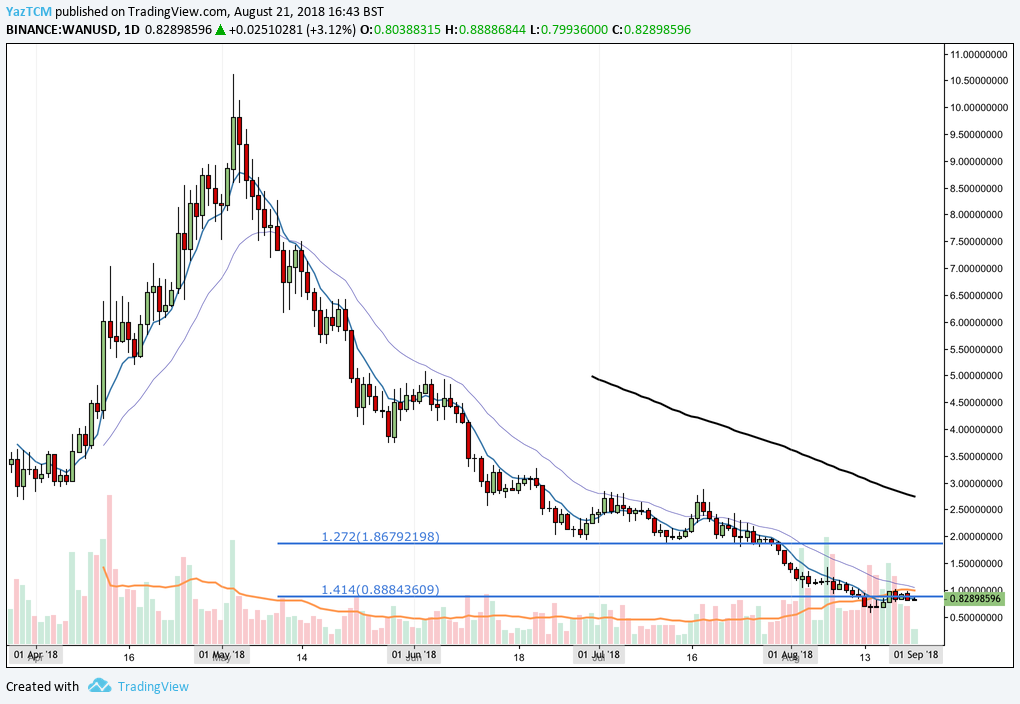
Analyzing price action from the long-term perspective above, we can see that the last 4 months have not been kind to Wanchain as the cryptocurrency saw sustained price decreases.
We can see that the market had experienced a bullish run throughout April 2018 as price action started from a low of $2.67 on March 30, 2018 and extended to an all-time high of $10.61 on May 3, 2018. This was a price increase totaling 295% from low to high.
Since placing the all-time high, price action has continuously rolled over. In June, the market began making fresh all-time lows and has continued to do so ever since. We can see that price action had approached support marked by a downside 1.272 Fibonacci Extension level priced at $1.86 in June 2018. This Fibonacci Extension is measured from the entire price drop witnessed throughout May 2018.
This price level had provided significant support for the market throughout July 2018. However, toward the end of the month, price action capitulated further and fell below. The market continued to drop slightly past the downside 1.414 Fibonacci Extension, and has since rebounded back to trading at resistance defined by this level.
Let us continue to analyze price action a little closer over the short term to highlight any potential support and resistance zones.
WAN/USD – SHORT TERM – DAILY CHART
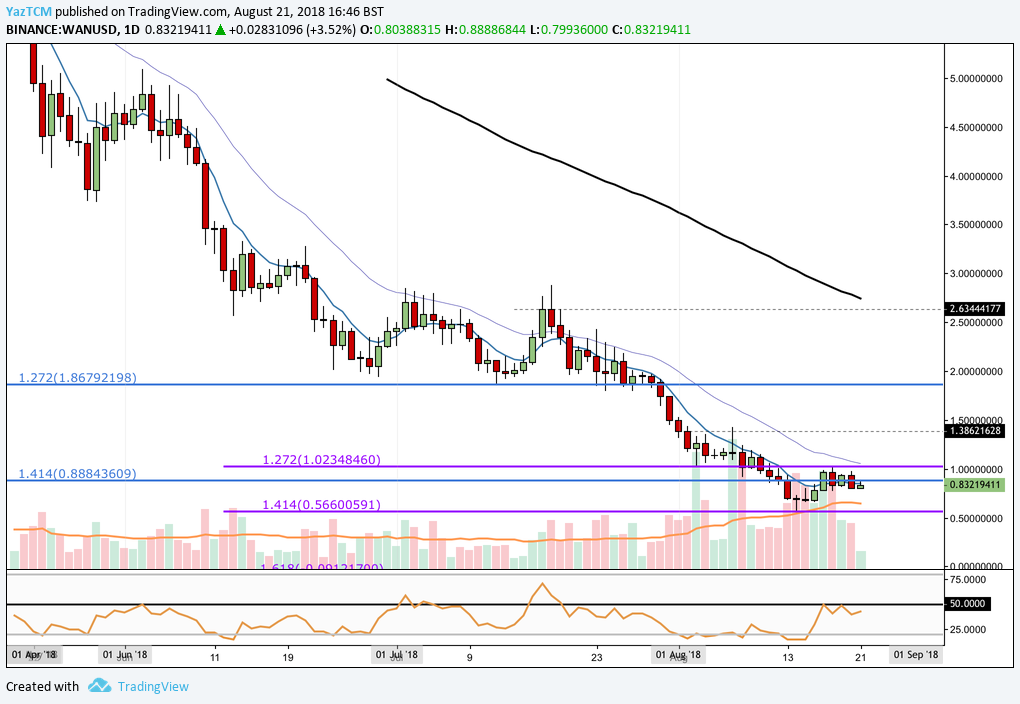
Analyzing the market with the advantage of a closer perspective, we can see that the recent price drop in August found support at a short-term downside at the 1.414 Fibonacci Extension level (drawn in purple) priced at $0.56. The market has rebounded at this support level, and is now currently trading at resistance marked by the short-term downside 1.272 Fibonacci Extension level priced at $1.02.
The market has been range-bound between these 2 levels, $0.56 and $1.02, for the past 11 trading sessions. If the market breaks above the upper boundary of the range, we expect immediate resistance to be located at previous resistance at the $1.38/$1.50 handle. Further resistance is located at the previous downside 1.272 Fibonacci Extension level (drawn in blue) priced at $1.86.
Alternatively, we expect any downside movements to be supported by the lower boundary of the range, marked at $0.56. Further support below this is difficult to calculate but we expect support at the psychological round number handles of $0.50, $0.40 and $0.25.
The technical indicators are still leaning toward favoring the bears at this current moment in time. Although the RSI is trading below the 50 handle, the recent rise of RSI from oversold conditions to the 50 level indicates that the previous bearish momentum has started to lose steam. If price action can cause a sustained break of the RSI above the 50 handle, this would signal that the bulls are beginning to create momentum.
Similarly, the moving averages are providing favor towards the bears as the short-term moving averages are aligned below the longer-termed moving averages. If the 7-day EMA (blue moving average) can cross up above the 21-day EMA (light purple moving average), this would signal a bullish crossover and signal that a bullish run could be in formation.
Let us continue to quickly analyze price action for Wanchain relative to Bitcoin over the same period.
WAN/BTC – MEDIUM TERM – DAILY CHART
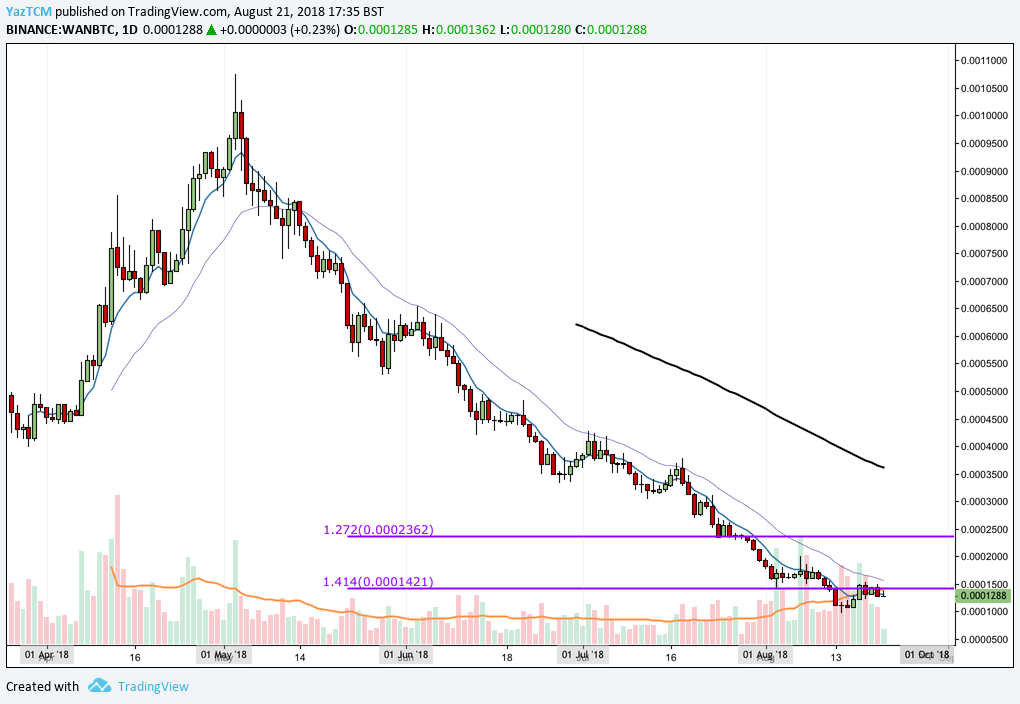
Analyzing price action for WAN/BTC, we can see that the market had experienced a bullish run during April as price action started from a low of 3,980 SATS on March 29, 2018 and extended to an all-time high of 10,753 SATS on May 3, 2018. This was a price increase totaling 170% from high to low.
We can see that after placing the all-time high, price action began a steep 4 month decline. We can see that the market had found some form of support at the downside 1.414 Fibonacci Extension level (drawn in purple) priced at 1,421 SATS, but the bearish market still pushed price action even further as the market hit an all-time low of 971 SATS on August 14, 2018.
Let us continue to analyze price action a little closer to highlight any potential support and resistance zones.
WAN/BTC – SHORT TERM – DAILY CHART
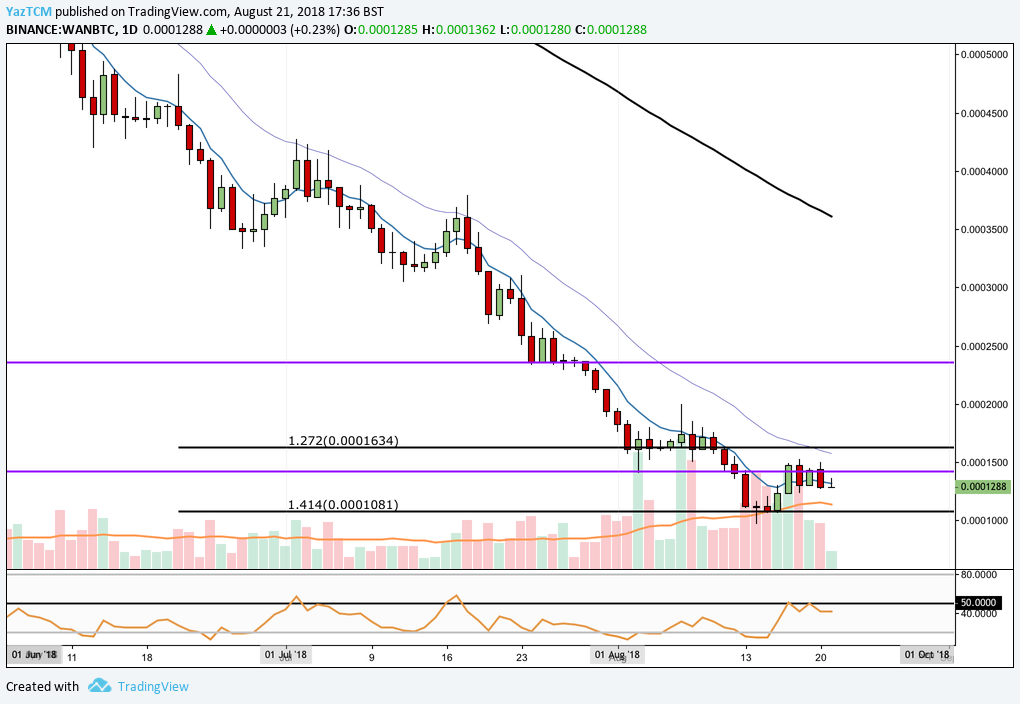
Analyzing the market at a closer time scale, we can see that recent bearish action had found support at a short-term downside 1.414 Fibonacci Extension pressed at 1,081 SATS. This price level provided significant support as the market rebounded a few trading sessions later.
Moving forward, if the market can break above the short-term downside 1.272 Fibonacci Extension level priced at 1,634 SATS, we expect immediate resistance to be located at the psychological round number handle of 2,000 SATS. Further resistance above this level can be expected at 2,363 SATS, followed by 3,000 SATS.
Any bearish pressure we expect to be absorbed by support at the downside short-term 1.414 Fibonacci Extension level of 1,081 SATS and the 1,000 SATS support handle.
The technical indicators are also favoring the bears within this market. The RSI is trading below the 50 handle but a break above 50 could signal the start to a fresh new upward trend.
Related: Wanchain 2.0 is Live, Allows For Interoperability With Ethereum