
- Wanchain has been slowly grinding higher over the past month and a half and has recently broken back above the $1.00 handle.
- Price action has been stuck in its consolidation phase as the market awaits for more volume to incite a new trend direction away from sideways movement.
- Support moving forward: $1.06, $1.00, $0.94, $0.77, $0.68, $0.60, $0.56.
- Resistance moving forward: $1.17, $1.32, $1.40, $1.55, $1.81, $1.95, $2.00, $2.15.
Wanchain has seen a small price decline totaling 1.93% over the previous 24 hours of trading. The cryptocurrency is presently exchanging hands at a price of $1.08 after seeing a relatively stable 7-day period where price action rose by 1.70%.
Wanchain is now ranked in 60th position with a total market cap value of $114 million. The 7-month old coin has seen a 10% increase over the past 30 trading days as it now trades at a value that is 81% lower than its all-time high price.
Let us begin by taking a look at WAN/USD over the long term and assessing the market behavior.
Wanchain Price Analysis
WAN/USD – LONG TERM – DAILY CHART
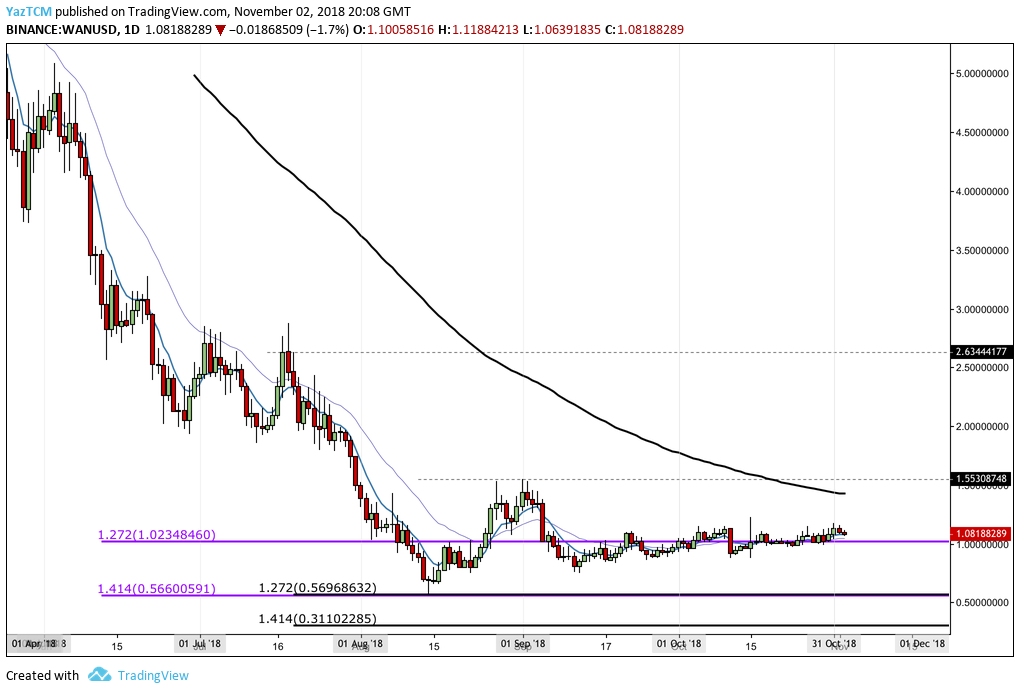
Looking at the long-term chart above, we can see that price action had seen a good few months of capitulation before some form of stabilization was found.
The support was provided by a downside 1.414 Fibonacci Extension level (drawn in purple) priced at $0.5660. This area of support was further reinforced by another shorter-term downside 1.272 Fibonacci Extension level (drawn in black) priced in the same area.
This area of combined support allowed for the market decline to reverse which resulted in WAN/USD trading sideways instead of downward.
Let us continue to take a closer look at price action in the past 3 months and highlight any areas of potential support and resistance.
WAN/USD – SHORT TERM – DAILY CHART
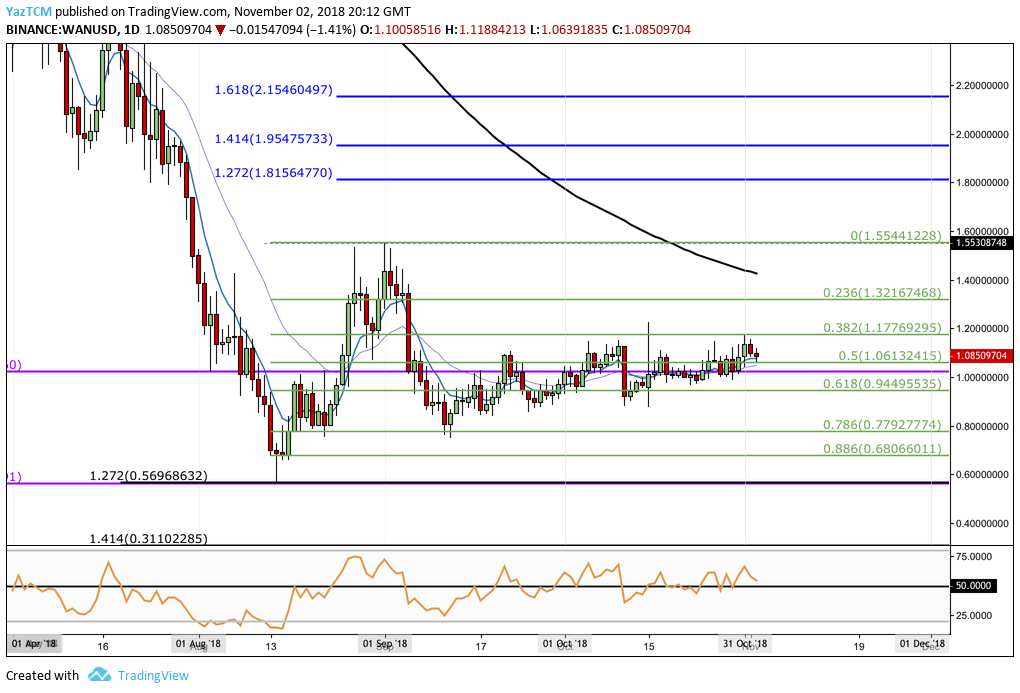
Analyzing price action from the short-term perspective above, we can see that the price reversal caused a short-term price hike which was an increase in value of around 169%. The market began at a low of $0.5699 on August 14, 2018 and continued to rise to a high of $1.5499 on September 1, 2018.
Price action rolled over after placing the high and began to decline, until support was met at the short-term .786 Fibonacci Retracement level (drawn in green) priced at $0.7792 during September 2018.
WAN/USD is currently now resting at support provided by the short-term .5 Fibonacci Retracement level (drawn in green) priced at $1.0613.
If the buyers can regroup at this support level and drive market action higher, then immediate expected resistance above can be located at the .382 Fibonacci Retracement level (drawn in green) priced at $1.17, followed by the .236 Fibonacci Retracement level (drawn in green) priced at $1.32.
If the bullish momentum can continue to push price action above $1.55, higher resistance above can then be located at the 1.272 and 1.414 Fibonacci Extension levels (drawn in blue), priced at $1.81 and $1.94 respectively. Provided the buyers can then break above the psychological resistance at $2.00, we can expect more resistance above at the 1.618 Fibonacci Extension level (drawn in blue) priced at $2.15.
Alternatively, in our bearish scenario, if the sellers manage to penetrate price action below the support at $1.06, the buyers can expect immediate support at the psychological round number handle at $1.00, followed by support at the short-term .618 Fibonacci Retracement level (drawn in green) priced at $0.9449.
If the bearish pressure continues to push WAN/USD even further lower, more support beneath can be located at the .786 and .886 Fibonacci Retracement levels, priced at $0.77 and $0.68 respectively. The final level of significant support located below to highlight is the August 2018 low priced at $0.5688.
The RSI has been climbing for the past 2 months and is presently trading above 50 which indicates that the bulls are in control of market momentum.
Let us proceed to analyze price action for WAN relative to BTC over the long term.
WAN/BTC – LONG TERM – DAILY CHART
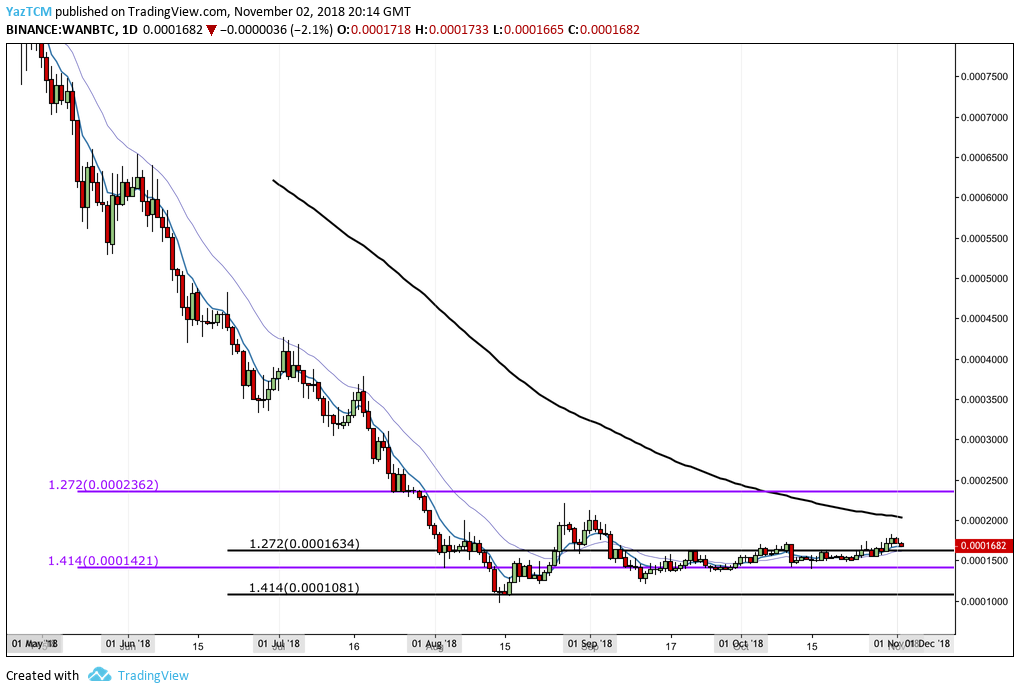
Observing price action for WAN/BTC above, we can see that the long and drawn out market decline had reached a reversal point during August 2018 as price action hit the downside 1.414 Fibonacci Extnesion level (drawn in black) priced at 1,081 SATS.
This area of support protected WAN/BTC from dipping below 1,000 SATS for too long, causing the market to consolidate in a sideways manner.
Let us take a closer look at WAN/BTC and highlight any possible support and resistance areas of interest.
WAN/BTC – SHORT TERM – DAILY CHART
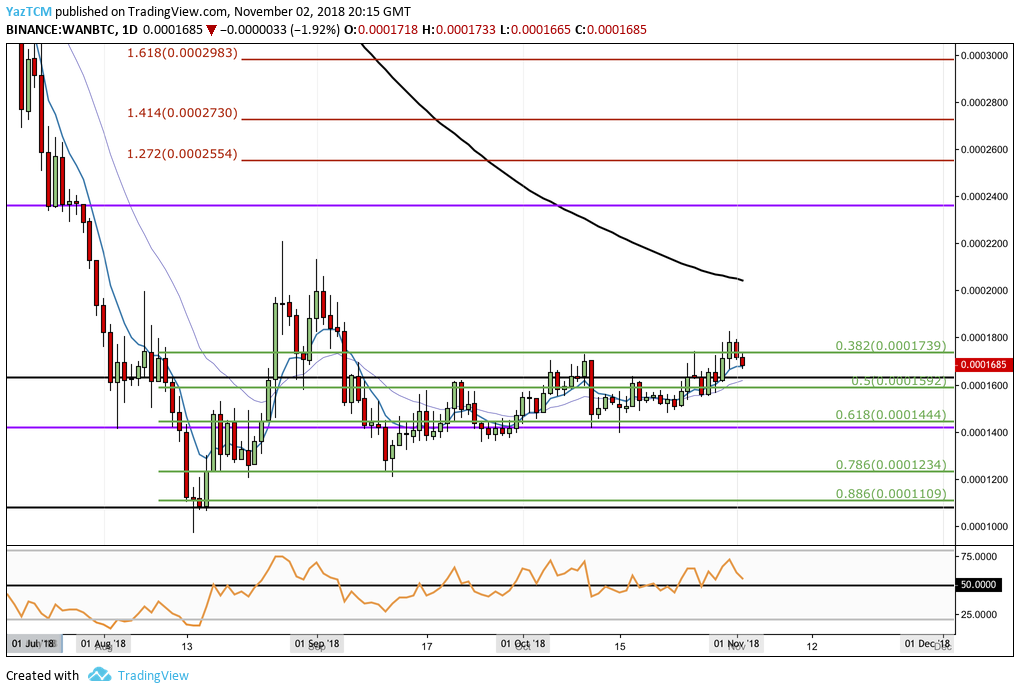
Analyzing the WAN/BTC market at a closer perspective, we can see the short-term price hike that began at a low of 971 SATS on August 14, 2018 and extended to a high of 2,210 SATS on August 27, 2018. This increase was 129% from low to high.
The market pulled back and retraced after placing the high to find support at the short-term .786 Fibonacci Retracement level priced at 1,234 SATS during September 2018.
WAN/BTC is now trading just below resistance provided by the .382 Fibonacci Retracement level priced at 1,739 SATS.
Moving forward, in our bullish scenario, if the buyers push the market above resistance at 1,800 SATS, then we can expect immediate resistance above at the round number handle at 2,000 SATS. Further resistance above this will be expected at the August 2018 high priced at 2,210 SATS.
The 100-day moving average is also trading slightly below 2,200 SATS, creating more resistance for the buyers to overcome.
If the bulls can climb up above the 2,210 SATS handle, higher resistance can be expected at the 1.272 and 1.618 Fibonacci Extension levels (drawn in red), priced at 2,554 SATS and 2,893 SATS.
On the other hand, for our bearish scenario, if the sellers continue to drive WAN/BTC lower, then support below can be expected at the .5 and .618 Fibonacci Retracement levels, priced at 1,592 SATS and 1,444 SATS respectively.
More support beneath this level can then be located at the .786 and .886 Fibonacci Retracement levels priced at 1,234 SATS and 1,109 SATS. WAN/BTC has not managed to break below the .786 Fibonacci Retracement level since mid-September so significant support is expected in this area.
The RSI is also providing a reading that favors the buyers within the market heavily as they currently control the momentum for WAN/BTC.