Litecoin has began to stabilize slightly this week after posting fresh 7-month lows during trading in June. The cryptocurrency is currently trading hands at a value of $80.35, at the time of writing, and is currently only down by 1.70% over the past 7 trading days.
Litecoin, LTC, was created in October 2011 by founder Charlie Lee. It was intended to become a cryptocurrency that was to be “lighter” than Bitcoin, hence the name Litecoin. The Litecoin network has faster transaction speeds and lower fees currently compared with Bitcoin. The Litecoin blockchain can boast superior tech than that of Bitcoin with advances such as SegWit and Atomic Swaps already ready. For more information about Litecoin, check out our “What Is Litecoin” guide.
Litecoin currently sits 6th in terms of overall market cap across the entire industry, with a total market cap value of $4.6 billion. This is a far cry from the market cap seen last month on June 3 standing at a total of $7.2 billion, a loss of $2.6 billion from today’s value. This is reflected by the 34.88% price value drop over the past 30 trading days.
To add further to this drop in market cap, we can also notice that the total volume has dropped by a total of 21% in June compared with volume from May. If we are to expect any type of bullish run we would need to see volume to start increasing again.
Let us analyze Litecoin’s price action over the course of the year.
Price Analysis
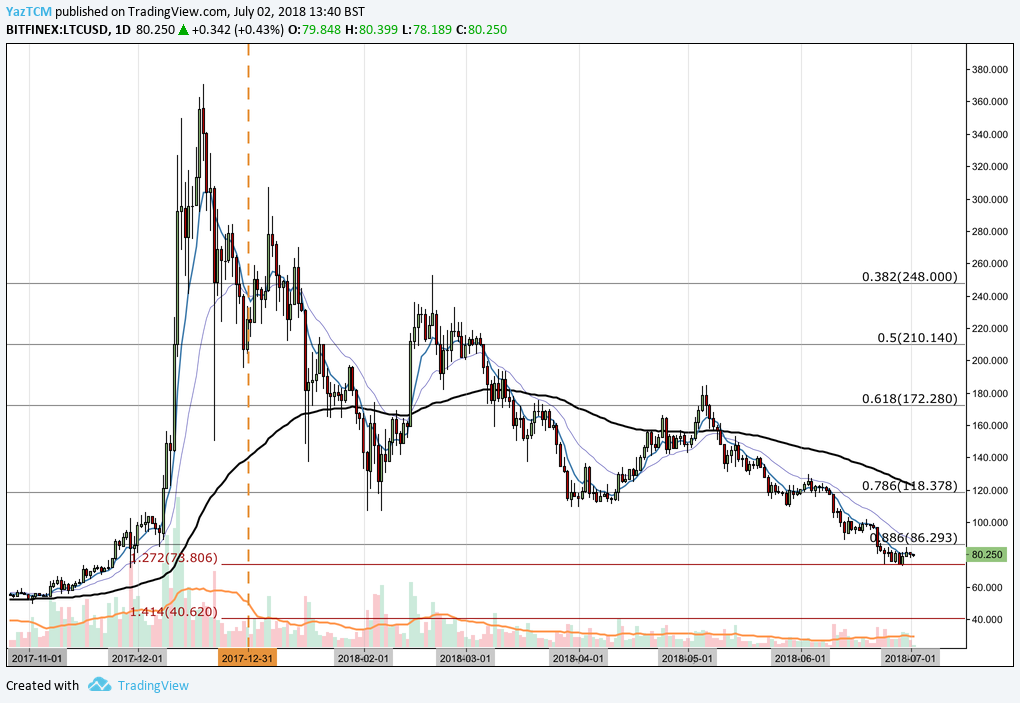
LTC/USD – LONG TERM – DAILY CHART
https://www.tradingview.com/x/rb08fdM4/
Analyzing price action from the long-term perspective shown in the chart above, we can see that Litecoin experienced an incredible bullish run starting from a low of $49.02 experienced on November 2, 2017 to a high of $370.78 played on December 19, 2017. This was an incredible price increase of close to 690% from low to high.
After placing this high, price action began to fade as 2018 started. The market originally found support at the .786 Fibonacci Retracement priced at $118.37 during February and this level of support continued to hold during March, April and May 2018. This is a Fibonacci Retracement taken from the bullish run between November and December 2017.
As June came along, the bearish momentum was significant enough to move the market below the .786 Fibonacci Retracement, falling past the .886 Fibonacci Retracement at $86.29 during the process. We can see that price action found support at a downside 1.272 Fibonacci Extension (marked in red) priced at $73.80. This is Fibonacci Extension taken from the bearish leg starting at the all time high on December 19 2017 at a price of $370.78 to the low witnessed on January 17 2018 at a price of $137.32.
If price action can hold above $73.80 and manages to close back above the .886 Fibonacci Retracement at $86.29, then we could expect the bullish momentum to take us back toward the .786 Fibonacci Retracement and possibly retest June’s highs of $129.87. Price action will also have to overcome the 100-day moving average (black line) to achieve this.
Alternatively, if the bearish pressure re-enters the market during the course of the first half of July and price action breaks below the downside 1.272 Fibonacci Extension, then support from a long term perspective, comes in at the 1.414 Fibonacci Extension at a price of $40.62. This would take the market to a low not experienced since September 2017.
Let us analyze price action over the more recent term a little closer to gauge some closer areas of support.
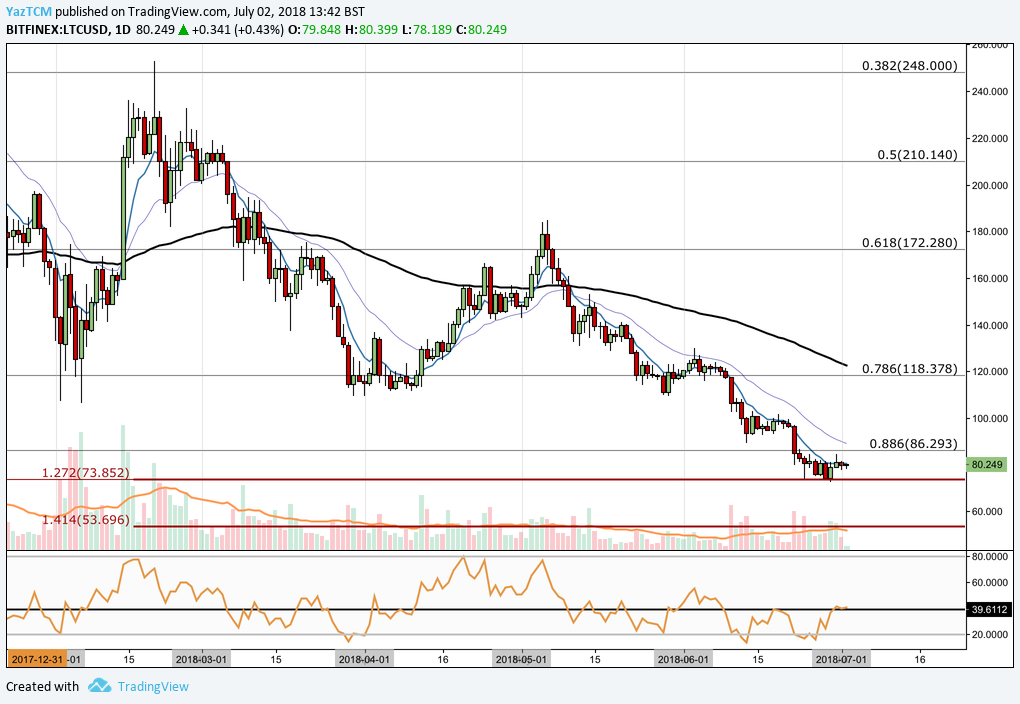
LTC/USD – SHORT TERM – DAILY CHART
https://www.tradingview.com/x/5flxDyMU/
Analyzing price action over the more recent period, we can see that Litecoin did not experience the same kind of bullish run that the majority of other altcoins had experienced during April. Although Litecoin did see a price increase of 67% from a low of $109.35 on April 1, 2018 to a high of $184.70 on May 6, 2017, this pales in comparison to the 250% Tron had experienced in the same period or the 195% increase that IOTA had experienced.
We can also see that the support received from the long-term downside 1.272 Fibonacci Extension is also bolstered by another downside 1.272 Fibonacci Extension seen at the same level. This short-term Fibonacci Extension is taken from the high of $252.86 on February 20, 2018, to the low of $109.43 on March 30, 2018.
The confluence of both of these extensions should provide ample support for the market around $73.85. If the market can hold here and eventually push back above the .886 Fibonacci Retracement, then the nearest resistance comes in at June’s highs. Further resistance can be found at the .618 Fibonacci Retracement at a price of $172.28 followed by May’s highs of $184.70.
Alternatively, if the bearish pressure continues and the market manages to penetrate below the 1.272 Fibonacci Extension at $73.85, then the nearest level of support comes in at the short term 1.414 Fibonacci Extension marked by a price level of $53.69. Further support below this can be located at they psychological round number handle of $50.
The technical indicators are steadily beginning to show increasing favor towards the bulls within the market. After spending the majority of June in bearish territory below the 50 handle, the RSI has managed to battle its way back toward 50 and is currently involved in a skirmish to break above 50. If RSI does mange to win the battle and close above the 50 handle, this would indicate that the last of the bearish momentum has left the market and the bulls may be able to pick up the slack witnessed over the past few months.
To add further to this, both the 7-day EMA (blue line) and the 21-day EMA (purple line) have began to ease the steepness of their declining angles. If the 7-day EMA can eventually head back toward the 21-day EMA and eventually cross above it, this would indicate that the short term bullish momentum has really began to increase.
Let us quickly analyze how Litecoin has been trading relative to Bitcoin over the course of the year.
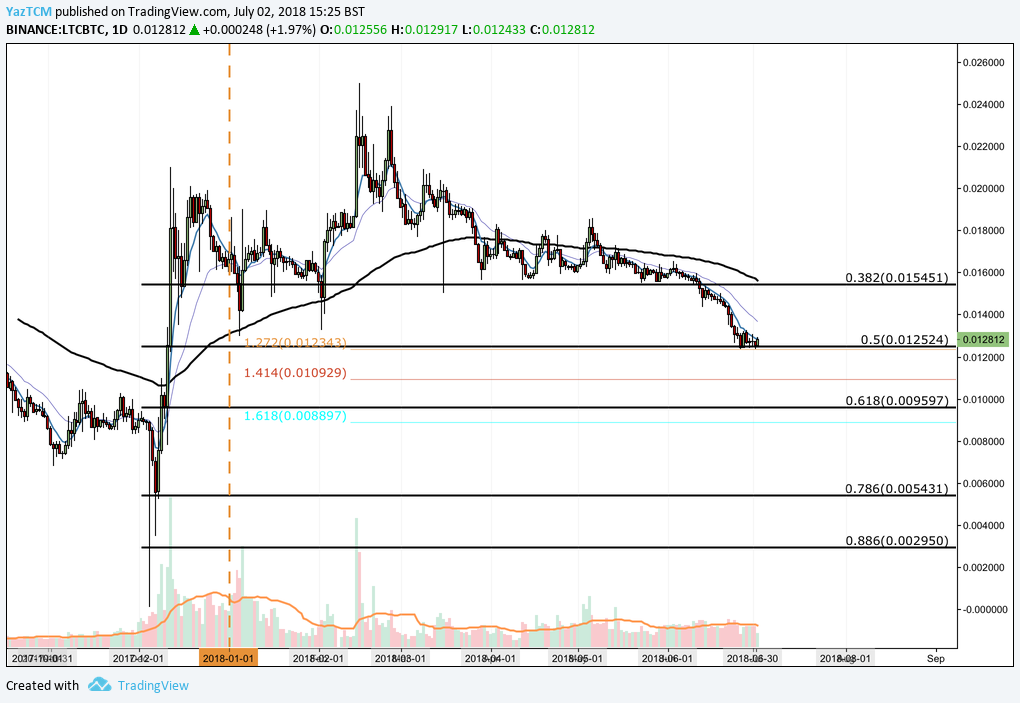
LTC/BTC – LONG TERM – DAILY CHART
https://www.tradingview.com/x/Oxklk4Qo/
Analyzing Litecoin’s market action relative to Bitcoin, we can see that price had experienced an incredible bullish run from a low of 0.008499 SATS on December 4, 2017 to an all-time high of 0.023698 SATS on January 14, 2018. This was an unbelievable 21,000% price increase from low to high.
Since placing this all-time high price action has depreciated, originally finding support at the .382 Fibonacci Retracement priced at 0.015451 from the majority of the remainder of the year. This is a Fibonacci Retracement taken from the epic bullish run outlined above.
Price action broke below the .382 Fibonacci Retracement during the previous month, June, as it fell lower and found support at the .50 Fibonacci Retracement priced at 0.012524. This area of support is also bolstered by a downside 1.272 Fibonacci Extension priced in the same area. This Fibonacci Extension is taken from the high seen in February to the low seen in March.
If price action can hold above the .50 Fibonacci Retracement level, then we could expect the bullish momentum to take us back to retest near term resistance at the .382 Fibonacci Retracement at a price of 0.015451.
Alternatively, if price action breaks below the .50 Fibonacci Retracement then near term support comes in at the 1.414 Fibonacci Extension priced at 0.010929 followed by the .618 Fibonacci Retracement priced at 0.009597.
Conclusion
The entire industry has experienced a long cycle of bearish action. Litecoin has reached an area of significant support in this moment in time. With Bitcoin beginning to show signs that the bearish trend could potentially be reaching exhaustion, could this area of support act as a reversal point for this long term bear cycle? The market shall reveal the answers over the coming month.
Related: 3 Cryptocurrencies That Stood Strong Against the Bears