
IOTA, the decentralized cryptocurrency dedicated to the Internet of Things, has seen a small price increase totaling 1.12% over the past 24 hours of trading. IOTA is now trading at a price of $0.5561 after seeing a price drop totaling 20% over the past rolling 30 trading days.
The IOTA/USD market has been trading in a period of consolidation as a range-bound condition over the past 6 weeks, bound between $0.49 and $0.81. In terms of market cap rankings, IOTA currently comes in 11th with a total market cap of $1.55 billion.
The cryptocurrency has experienced a precipitous 52% price decline over the past 90 trading days, and is still trading at a value that is 89% lower than its all-time high price.
Let us continue to analyze price action for IOTA over the long term.
IOTA Price Analysis
IOTA/USD – LONG TERM – DAILY CHART
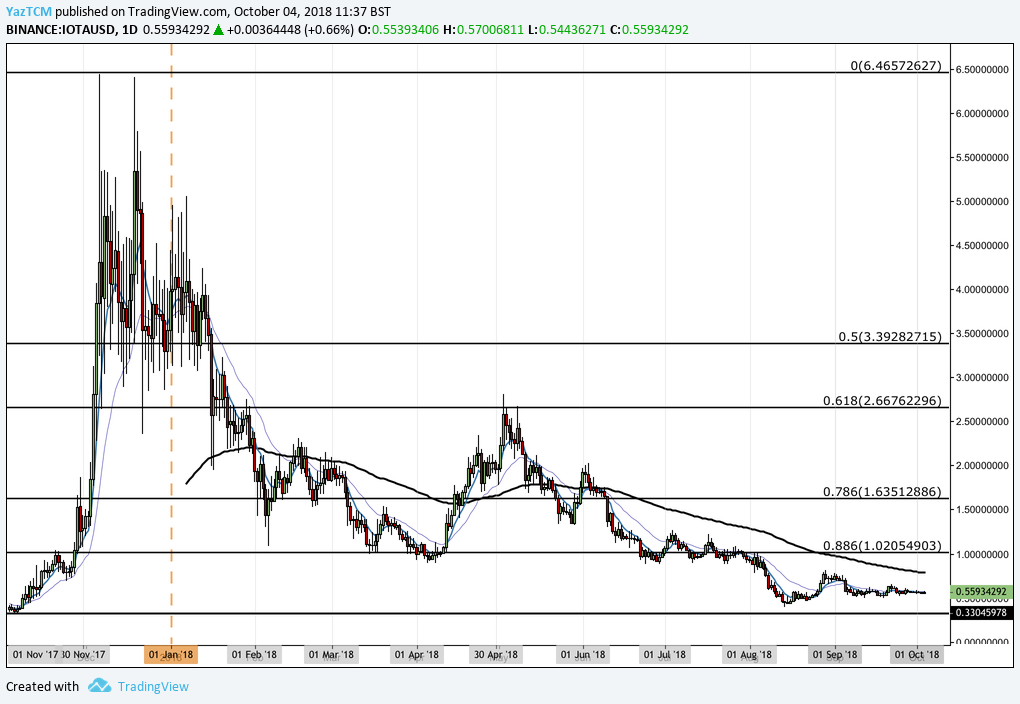
Like most cryptocurrencies within the market, IOTA experienced a serious bullish run toward the end of 2017. We can see that price action had started from a low of $0.03289 on November 5, 2017 and had risen to an all-time high price of $6.4393 by December 6, 2017.
The overall price increase for this bullish run totaled over an extraordinary 2,000%.
We can see that, after placing the all-time high, the market reached resistance and reversed. It continued to decline as the trading year progressed, originally finding support at the .886 Fibonacci Retracement level priced at $1.02 during April 2018.
Price action managed to remain relatively stable above this support level for the majority of the year. However, in the disastrous market conditions during August 2018, price action dipped below the support level and fell as low as $0.39.
To identity any potential support and resistance areas, let’s look at price action over the short term.
IOTA/USD – SHORT TERM – DAILY CHART
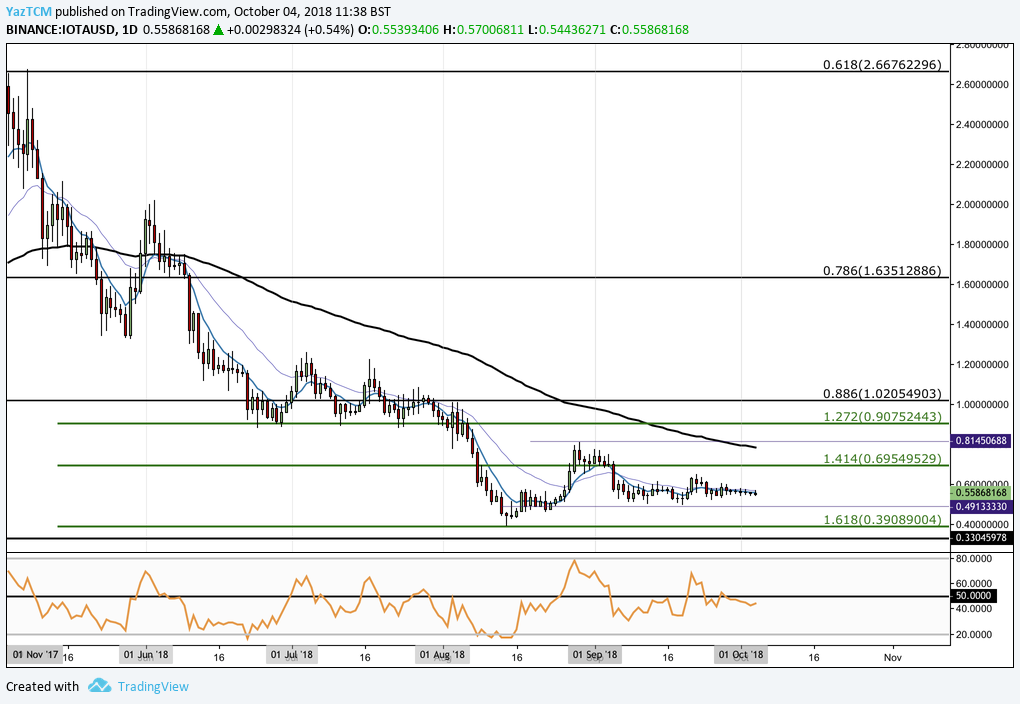
Taking a look at the IOTA market with the benefit of a closer perspective, we can observe that during August 2018, as price action collapsed, it had found support provided by a downside 1.618 Fibonacci Extension level priced at $0.39089. After price action reached this level of support, it went on to ascend.
We can see that price action continued to rally until it met resistance at $0.8145 and rolled over.
For the majority of the past 6 weeks, the market for IOTA has been trading in a very narrow range bound trading condition. The lower boundary of the range is priced at $0.4913 and the upper boundary of the range is priced at $0.8145.
If the bulls can regenerate momentum and push price cation higher, our first level of resistance is expected at the downside 1.414 Fibonacci Extension level priced at $0.6954. Further resistance above this level will then come in at the upper boundary of the trading range priced at $0.8145.
It is important to highlight that the resistance in this area is significantly bolstered by the 100-day moving average which currently hovers around the $0.80 handle.
If the bullish momentum can continue even higher above the upper boundary of the range, we can expect more resistance higher to be located at the 1.272 Fibonacci Extension level priced at $0.9075. We can see that price level had provided significant support for the market during June and July 2018, so it is expected to provide a similar level of resistance moving forward.
Further higher resistance can be located at the long-term .886 Fibonacci Retracement level priced at $1.0205.
On the other hand, if the bears regather momentum and push price action lower, we expect immediate significant support to be provided by the lower boundary of the trading range priced at $0.4913. If they can penetrate below this level, we can expect some more support to be located at the previous downside 1.618 Fibonacci Extension level priced at $0.3908.
The RSI technical indicator has recently swung into the favor of the bears as it penetrates slightly below the 50 handle. This indicates that the bears are beginning to gain possession of the momentum within the market. If we would like to see some positive action for IOTA/USD, we would need to see RSI break back above 50.
Next, let’s look at the price action of IOTA relative to BTC over the long term.
IOTA/BTC – LONG TERM – DAILY CHART
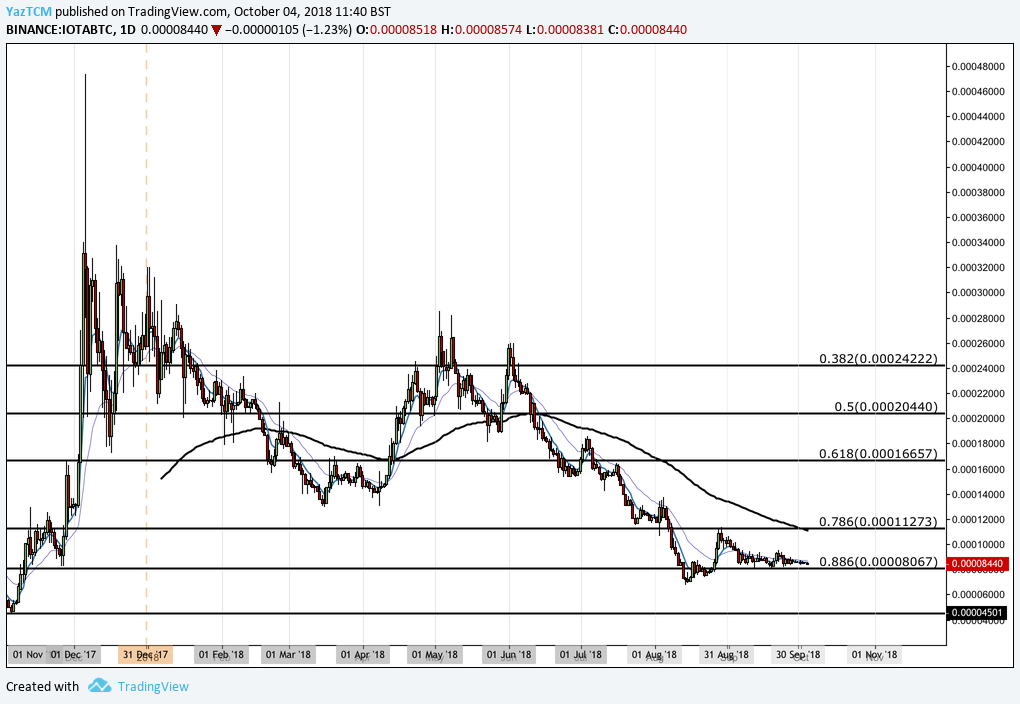
Analyzing the market for IOTA/BTC over the long term, we can see the bullish run beginning from a low of 4,523 SATS on November 5, 2017 and rising to an all-time high value of 47,352 SATS on December 6, 2017. This was a price increase totaling over 900%.
We can see that the market began a steady decline over the trading year after placing the all-time high. Price action is currently trading very close to support provided by the .886 Fibonacci Retracement level priced at 8,067 SATS.
Let us analyze price action a little closer over the short term to highlight any potential support and resistance areas.
IOTA/BTC – SHORT TERM – DAILY CHART
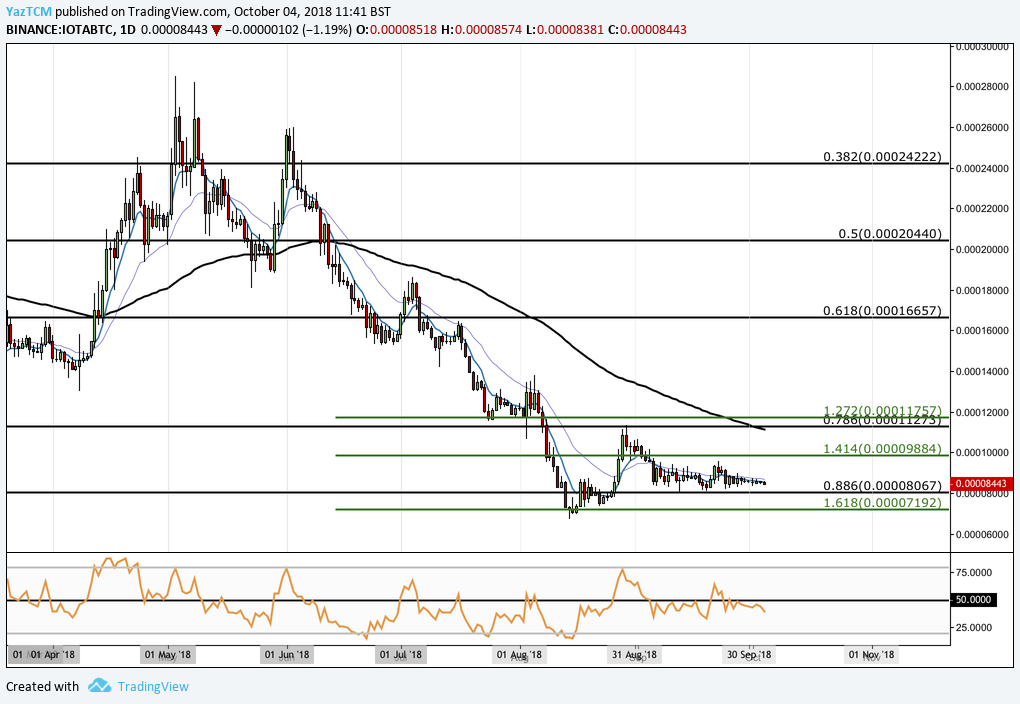
Analyzing price action for IOTA/BTC a little closer, we can see that IOTA had found some support at the downside 1.618 Fibonacci Extension level priced at 7,192 SATS during August 2018.
This was the lowest point for the market throughout the entire trading year. Price action rebounded from this low point and began to rise.
The market rallied until meeting resistance at the long-term .786 Fibonacci Retracement level priced at 11,273 SATS. During September 2018, we can clearly see the established trading range bound between the .886 and the .786 Fibonacci Retracement levels, priced at 8,067 SATS and 11,273 SATS.
If the bulls can group together and push price action higher, we can expect immediate significant resistance above to be located at the downside 1.414 Fibonacci Extension level priced at 9,884 SATS. Resistance above this level can then be located at the upper boundary of the trading range priced at 11,273.
The upper boundary of the range also contains the 100-day moving average which will considerably bolster the expected resistance at this level. Therefore the market will require significant volume and momentum to overcome this resistance.
Alternatively, if the bears push price action lower, we expect immediate support to be provided by the lower boundary of the trading range priced at 8,067 SATS. If the bears push price action below the lower boundary, then we can expect further support below to be around the downside 1.618 Fibonacci Extension level priced at 7,192 SATS.
The RSI technical indicator has also swung into the favor of the bears as it trades below the 50 handle.
Related: IOTA Trinity Desktop Beta Wallet: Wallet Features and How to Set It Up