
- Support for ETH moving forward: 102.55, $101.27, $100, $95.15, $93.00, $84.03.
- Resistance for ETH moving forward: $109.78, $110.46, $115.15, $124.91, $134.67.
Ethereum Price Analysis
Ethereum has seen a 2.29% price decline over the past 24 hours of trading, bringing the current trading price down to $107.60, at the time of writing. The cryptocurrency has now seen a steep 9.26% price fall over the past 7 trading days, with a further 21% price plummet of their past trading month.
Ethereum remains in 3rd position as it currently holds a $11.11 billion market cap valuation. The 42-month old project now trades at a value that is 92% lower than the all-time high price.
ETH/USD Price
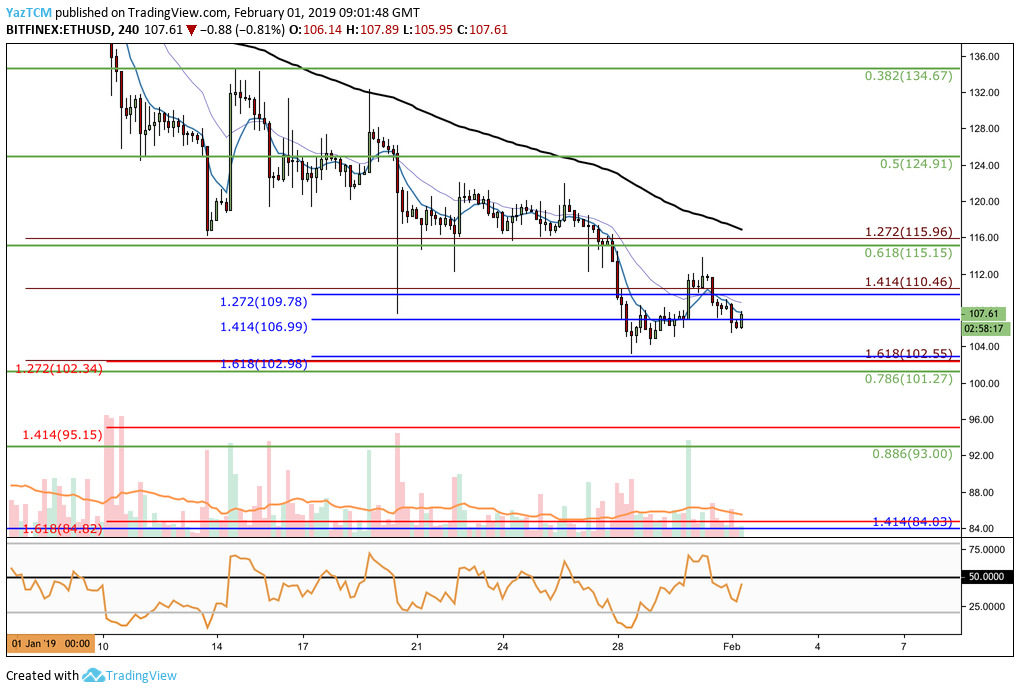
Since our last ETH//USD analysis, we can see that the market rebounded from the support at the $102 handle. The market went on to rise until it reached resistance at the $113 handle, before rolling over.
Price action has since fallen again, and is now trading just above support at a very short-term downside 1.414 Fibonacci Extension level (drawn in blue) priced at $106.99.
Trend: Bearish
The current market trend is still bearish as price action struggles to make any higher highs within the market. If ETH/USD can break above the $115 handle, the market condition would turn into a neutral condition.
For this market to be considered bullish, price action would need to rise and break above the $130 handle.
Where is ETH/USD Likely to Head Towards Next?
Price action is currently trapped within a bearish trend, and therefore we can assume ETH/USD will likely head lower and continue to make lower lows for 2019.
If this is the case and price action starts to fall below the current support at the very short-term downside 1.414 FIbonacci Extension level (drawn in blue) priced at $106.99, we can expect immediate further support below at the short-term downside 1.618 FIbonacci Extension level (drawn in blue) priced at $102.98.
Further support below this can then be expected at the short-term .786 Fibonacci Retracement level (drawn in green) priced at $101.27.
If the sellers continue to drive price action below the $100 handle, there is more support beneath at the medium-term downside 1.414 FIbonacci Extension level (drawn in red) priced at $95.15. This is then followed by further support at the short-term .886 Fibonacci Retracement level (drawn in green) priced at $93.00.
If the bearish pressure continues to push the market below $90, we can then expect further strong support below to be located at the long-term downside 1.414 Fibonacci Extension level (drawn in blue) priced at $84.03. This level had supported the market during the 2018 decline and is expected to supply an equal level of support moving forward.
What if the Bulls Regain Momentum?
Alternatively, if the buyers begin to pick up momentum and drive price action higher, we can expect higher resistance at the short-term downside 1.414 Fibonacci Extension level (drawn in red) priced at $110.46.
Resistance above $110 can then be located at the short-term .618 and .5 Fibonacci Retracement levels (Drawn in green) priced at $115.15 and $124.91, respectively.
If the buyers can push the market higher above $125, then further resistance can be expected at the short-term .382 FIbonacci Retracement level (drawn in green) priced at $134.67.
ETH/BTC Price
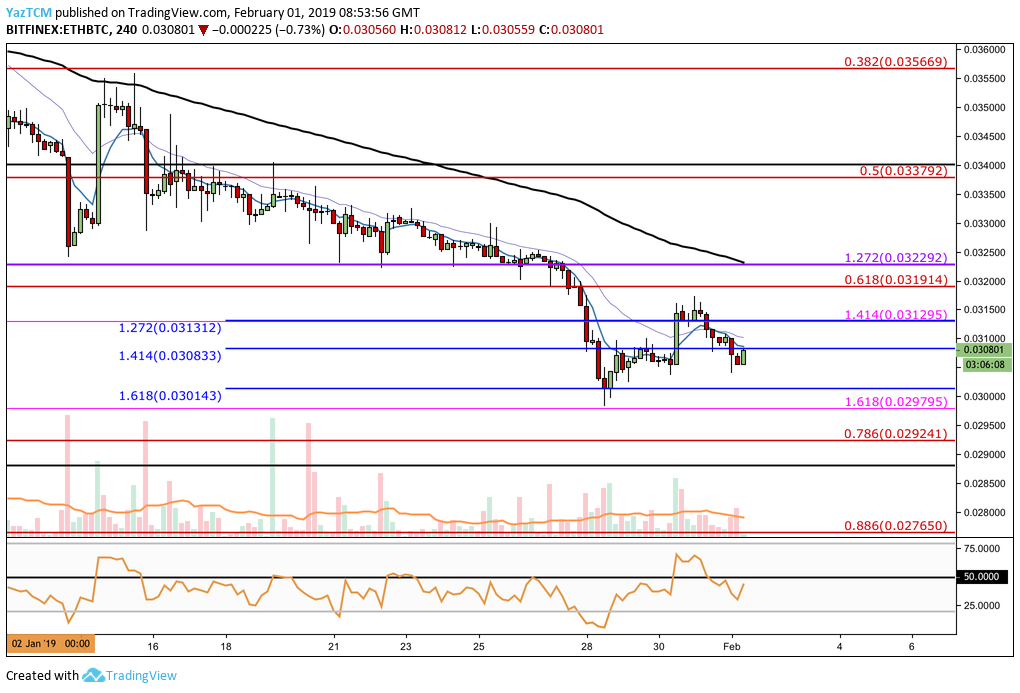
Since our last analysis for ETH/BTC, we can see that price action had also rebounded from the medium-term downside 1.618 FIbonacci Extension level (drawn in pink) priced at 0.02979 SATS
More specifically, the support was located at a short-term downside 1.618 FIbonacci Extension level (drawn in blue) priced at 0.030143 SATS.
Price action went on to rise until it reached resistance at the 0.03172 SATS handle, and then rolled over. The market is now trading just below resistance at the short-term downside 1.414 Fibonacci Extension level (drawn in blue) priced at 0.03083 SATS.
Trend: Bearish
The market trend for ETH/BTC is still bearish.
For this market to be considered bullish in the short term, we would need to see price action break above the 0.032 SATS handle to create a fresh higher high.
Where is the ETH/BTC Market Likely to Head Towards Next?
As the market is bearish, we can assume price action will continue to head lower and create lower lows.
Immediate support below the current market price is located at the short-term downside 1.618 Fibonacci Extension level (drawn in blue) priced at 0.030143. This is closely followed by more support at the medium-term downside 1.618 Fibonacci Extension level (drawn in pink) priced at 0.02979 SATS.
If the market continues to head below 0.02979 SATS, we can expect more support beneath at the short-term .786 and .886 Fibonacci Retracement levels (drawn in red), priced at 0.02924 SATS and 0.02765 SATS respectively.
What if the Bulls Regain Control?
Alternatively, if the buyers can resume control and begin to push price action higher, we can expect immediate resistance above to firstly be located at the medium-term downside 1.414 Fibonacci Extension level (drawn in pink) priced at 0.03129 SATS. Next, there is more resistance at the short-term .618 Fibonacci Retracement level (drawn in red) priced at 0.03191 SATS.
Further higher resistance can then be expected at the short-term .5 and .283 Fibonacci Retracement levels (Drawn in red) priced at 0.03379 SATS and 0.03566 SATS, respectively.
Conclusion
The Ethereum market, like the current entire cryptocurrency market, is experiencing a troubling time as price action makes lower lows for 2019.
If Ethereum continues to break lower, we can expect strong support to be located at the $100 handle. If it breaks below $100, it is likely that the market will head towards the December 2018 lows around $84.03.