
- Support for ETH moving forward: $102.55, $101.27, $95.15, $93, $84,03.
- Resistance for ETH moving forward: $110.46, $115.15, $124.91, $134.67, $146.74, $155.12.
Ethereum Price Analysis
Over the past 24 hours of trading, the Ethereum market has lost a total of 3.59%, bringing the current trading price down to around $105.04 at the time of writing. The cryptocurrency has now seen a 10% price fall over the past 7 trading days, with a further 24.54% price decline over the past 30 trading days.
Now ranked in 3rd position, Ethereum currently holds a $10.94 billion market cap valuation. With a 47% price fall over the past 90 trading days, the 42-month old project is now trading at a value that is 92% lower than the all-time high price.
ETH/USD Price
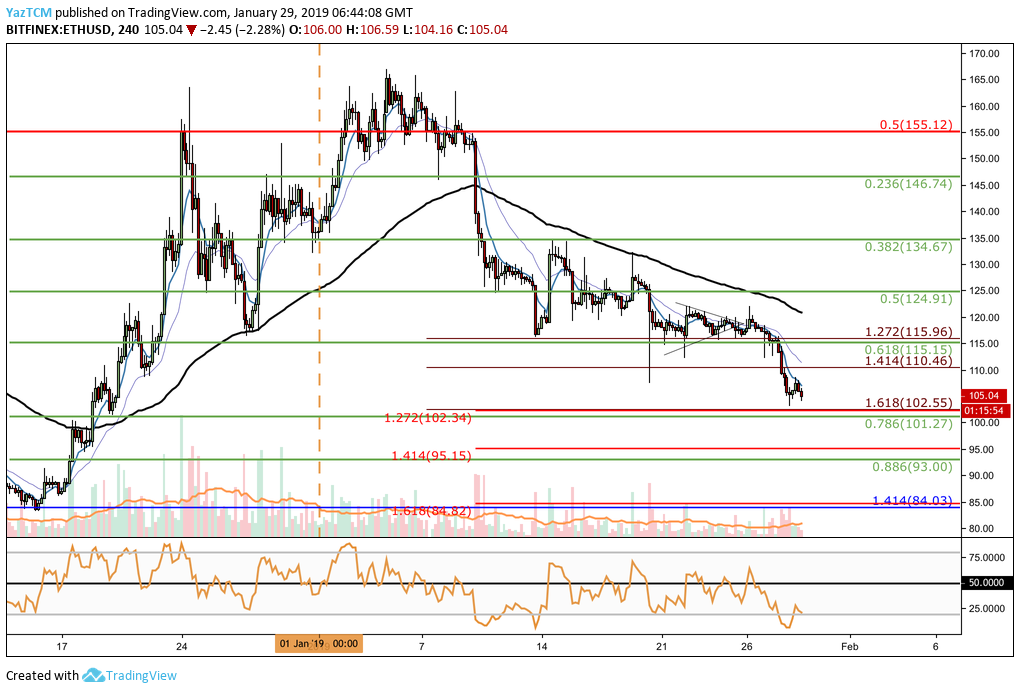
Analyzing price action from the 4-hour perspective above, we can see that since our last analysis, price action has broken below our short-term symmetrical triangle that was identified.
The market then went on to penetrate through our strong support level at the short-term .618 Fibonacci Retracement level (drawn in green) priced at $115.15.
After breaking below $115, price action first dropped below the short-term downside 1.414 Fibonacci Retracement level (drawn in dark red) priced at $110 and then continued lower. The market had almost reached support at the short-term downside 1.618 Fibonacci Extension level (drawn in dark red) priced at $102.55, but reversed just shy of this level at $103.20.
Price action is still heading lower, at the time of writing, as it continues to approach the support at $102.55.
Trend: Bearish
Price action has recently made fresh lows for 2019, and therefore the market is certainly bearish at this moment in time. For this market to be considered bullish, we would need to see price action break above the $135 handle.
Where is ETH/USD Likely to Head towards Next?
As the momentum is with the bears, we can expect price action to continue to head lower into initial support at the short-term downside 1.618 Fibonacci Extension level (drawn in dark red) priced at $102.55. This is closely followed by more support at the short-term .786 Fibonacci Retracement level (drawn in green) priced at $101.27.
If the sellers continue to drive price action for ETH/USD further beneath the $100 handle, there is further support below at another short-term downside 1.414 Fibonacci Extension level (drawn in red) priced at $95.15. Following this, there is more support at the short-term .886 Fibonacci Retracement level (drawn in green) priced at $93.
If the ETH market goes below the $90 handle, then we can expect more support at the previous long-term downside 1.414 Fibonacci Extension level (drawn in blue) priced at $84.03. This level of support was the area in which the late-2018 bearish run had reversed during mid-December 2018, so strong support is expected in this area.
What if the Bulls Regain Control?
Alternatively, if the bulls can regain some form of control around the support area at $102.55 and begin to push price action higher, we can expect immediate resistance above at the previous short-term downside 1.414 Fibonacci Extension level (drawn in dark red) priced at $110.46. More resistance can be found at the short-term .618 Fibonacci Retracement level (drawn in green) priced at $115.15.
If the buyers continue to drive price action above $120, there is further higher resistance at the short-term .5 and .382 Fibonacci Retracement levels (drawn in green), priced at $124.91 and $134.67 respectively.
ETH/BTC Price
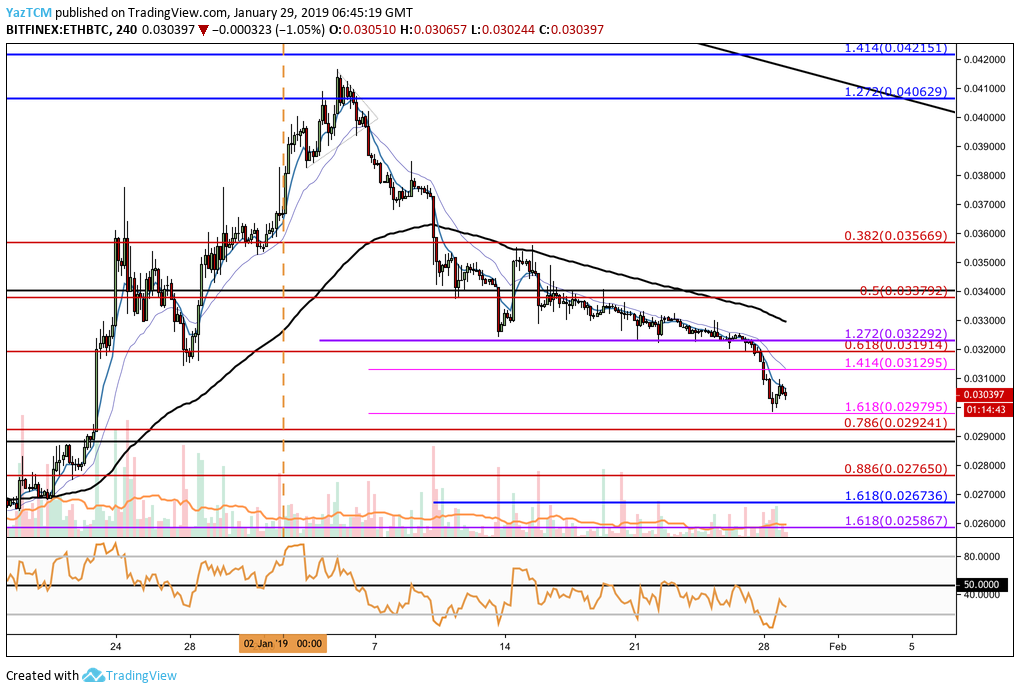
Looking at price action for ETH/BTC over the recent period, we can see that price action has broken below our previously identified support at the short-term .618 Fibonacci Retracement level (drawn in red) priced at 0.031914 SATS.
The market continued to fall further, and has recently reached support at the short-term downside 1.618 Fibonacci Extension level (drawn in pink) priced at 0.02979. After price action reached this area, the market bounced and headed higher slightly.
Trend: Bearish
The trend for ETH/BTC is also bearish after the break below 0.03191 SATS.
Where is ETH/BTC Likely to Head towards Next?
If the sellers continue to keep their foot on the gas and push price action below 0.03 SATS once again, we can expect immediate support towards the downside at the short-term downside 1.618 Fibonacci Extension level (drawn in pink) priced at 0.02979 SATS.
This is closely followed by more support at the short-term .786 Fibonacci Retracement level (drawn in red) priced at 0.02924 SATS.
If ETH/BTC falls below the 0.028 SATS level, there is more support below at the short-term .886 Fibonacci Retracement level (drawn in red) priced at 0.02765 SATS.
The final level of support to highlight is located at the long-term downside 1.618 Fibonacci Extension level (Drawn in purple) priced at 0.02586 SATS.
What if the Buyers Regain Control?
Alternatively, if the bulls push price action higher, we can expect immediate resistance above at the short-term 1.414 Fibonacci Extension level (Drawn in pink) priced at 0.03129 SATS, followed by the short-term .618 Fibonacci Retracement level (drawn in red) priced at 0.03191 SATS.
Further higher resistance above this can then be found at the short-term .5 and .382 Fibonacci Retracement levels (drawn in red), priced at 0.03379 SATS and 0.03566 SATS respectively.
Conclusion
The new 2019 price low for Ethereum will put a lot of pressure on investors for the first time in 2019. As Ethereum flirts with penetrating below $100 again, speculators could grow cautious and may start unwinding their positions, causing further price declines.