
Latest Ethereum News
The long-awaited Ethereum Constantinople upgrade now draws closer and is expected to be implemented on block 7,280,000, estimated to occur towards the end of February 2019. The upgrade was scheduled for last month but was delayed as an audit firm had found some potential bugs in the code which needed to be addressed.
The upgrade will integrate a selection of Ethereum Improvement Protocols (EIPs) that is intended to help improve the performance of the sluggish Ethereum blockchain. It should bring a great deal of excitement for the cryptocurrency as it starts to implement changes to make its blockchain more competitive against its rivals.
In other Ethereum news, NASDAQ, is set to launch their Ethereum and Bitcoin indices on February 25, 2019. The indices will be labelled as the Ethereum Liquid Index (ELX) and the Bitcoin Liquid Index (BLX), and are intended to provide real-time spot rates for both markets.
Ethereum Price Analysis
Ethereum has now seen a price hike totaling 15.49% over the previous 7 trading days, bringing the current trading price up to around $124.53, at the time of writing.
The 42-month old project now sits in 2nd position with a total market cap of $12.87 billion. However, the market still has room to recover after losing a total of 29.64% over the previous 90 trading days.
ETH/USD Price
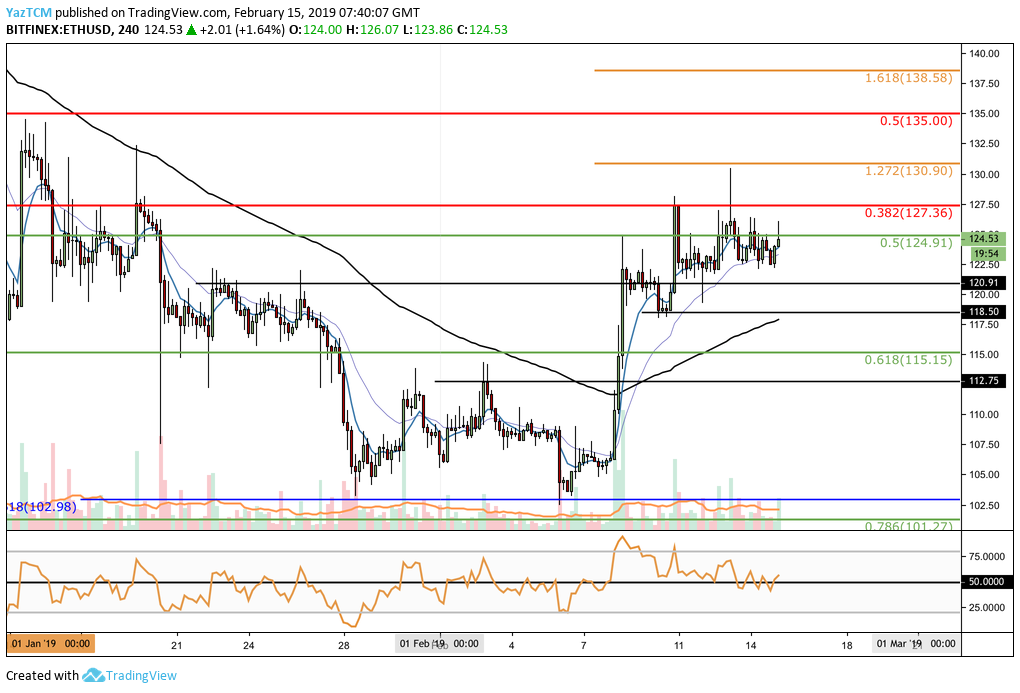
Analysing the 4HR ETH/USD chart above, we can see that Ethereum has continued to trade sideways since our previous analysis. The market is currently limited towards the upside by a bearish .382 Fibonacci Retracement level (drawn in red) priced at $127.36.
During the week, price action attempted to break above as the market had managed to spike upwards to a high above $130. However, the sellers stepped back in and caused the close of the candle to finish back below the resistance at the $127.36 level.
Trend: Bullish
The market is still in a bullish trending condition at this moment in time. For the bullish trend to continue higher, we need to see ETH/USD break and close above the $130 handle. If price action manages to fall beneath the $120 handle, we can consider the market to be neutral.
For this market to be considered bearish, we would need to see price action fall and break below the $115 level.
Where is the Market Likely to Head Towards Next?
We can see that price action is still struggling to break above the resistance at $127.36. We can expect ETH/USD to continue to trade sideways as it battles to break above this aforementioned resistance.
If the bulls can eventually climb above the $127.36 resistance level, there is immediate higher resistance located at the short-term 1.272 Fibonacci Extension level (drawn in orange) priced at $130.90.
Further higher resistance will then be located at the bearish .5 Fibonacci Retracement level (drawn in red) priced at $135. This is closely followed by more resistance at the short-term 1.618 Fibonacci Extension level (drawn in orange) priced at $138.58.
If the buyers continue to breach above the $140 handle, then the bearish .618 Fibonacci Retracement level (not displayed on the chart) will also provide higher resistance located at the $142.63 level.
What if the Bears Regain Control?
Alternatively, if the sellers regroup and begin to push ETH/USD price action lower again, we can expect immediate support below to be located at the $120.91 and $118.50 levels.
If the sellers cause ETH/USD to fall further, there is more support below at the medium-term .618 Fibonacci Retracement level (drawn in green) priced at $115.15. This is closely followed by more support at the $112.75 level.
If price action drops below the psychological support at $110, we can expect more support located at the $105 level, followed by support at the medium-term downside 1.618 Fibonacci Extension level (drawn in blue) priced at $102.98. The $102.98 level has provided ample support for the market during January and February 2019, and therefore is expected to provide strong support moving forward.
ETH/BTC Price
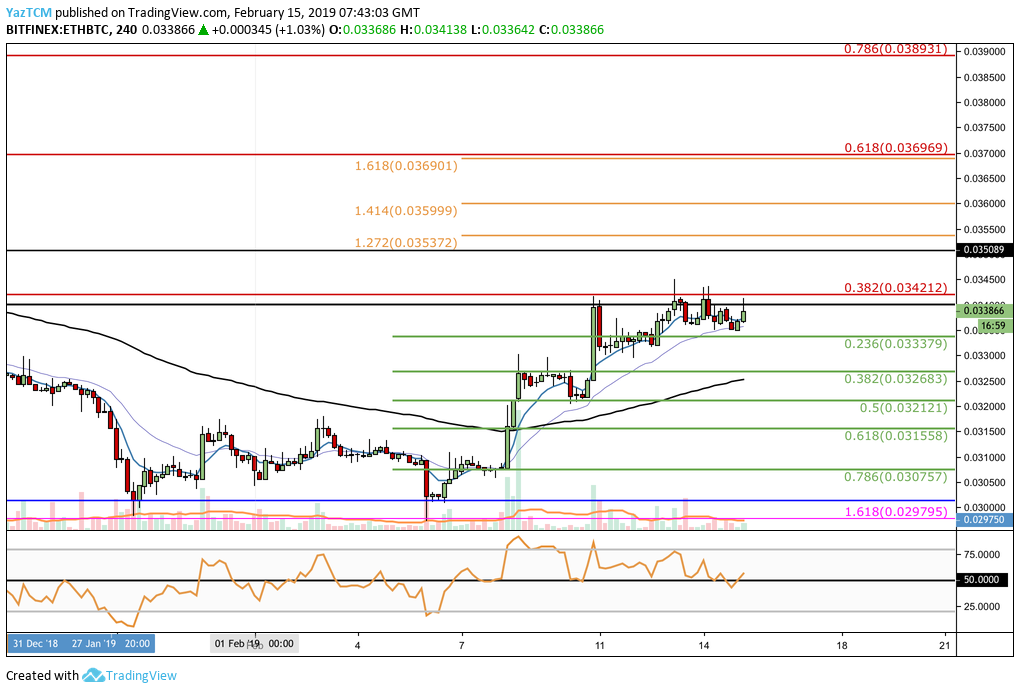
Taking a look at ETH/BTC from the 4HR perspective above, we can see that price action has also traded sideways since our previous analysis as the market struggled to break above the 0.034212 BTC level.
Trend: Bullish
The current trading trend remains bullish at this moment in time.
For the bullish trend to persist, we need to see ETH/USD break above the 0.034212 BTC level. If price action falls beneath 0.032683 BTC, then the market will be considered bearish in the short term.
Where is the ETH/BTC Market Likely to Head Towards Next?
We expect price action for ETH/BTC to continue to trade sideways and battle the 0.034212 BTC resistance level.
If the buyers can cause the market to penetrate above the aforementioned resistance, we can expect more resistance above at the 0.035 BTC level which had provided resistance for the market during mid-January.
Further higher resistance above this can be found at the short-term 1.272 and 1.414 Fibonacci Extension levels (drawn in orange) priced at 0.03537 BTC and 0.035999 BTC, respectively.
If the bullish pressure can cause the market to climb above 0.036 BTC, we can expect higher resistance at the bearish .618 and .786 Fibonacci Retracement levels (drawn in red), priced at 0.03696 BTC and 0.03893 BTC respectively.
What if the Sellers Resume Control?
Alternatively, if the sellers begin to push price action lower, we can expect immediate support towards the downside to be located at the short-term .236 and .382 Fibonacci Retracement levels (drawn in green), priced at 0.03337 BTC and 0.03268 BTC respectively.
More support below is then expected at the short-term .5 and .618 Fibonacci Retracement levels (drawn in green), priced at 0.03213 BTC and 0.03155 BTC respectively.
Conclusion
After such an epic rise over the past week, it is understandable that the market may be struggling to break above the current resistance level.
However, with the Constantinople upgrade looming on the horizon, we can most certainly expect ETH/USD to break above the $127 level and for ETH/BTC to break above the 0.034212 BTC level — it is just a matter of when it will happen.