
- Support for ETH moving forward: $120, $115.15, $110.46, $102.55, $100.
- Resistance for ETH moving forward: $124.91, $127.36, $130.90, $134.05, $135, $138.58, $142.63.
Ethereum Price Analysis
The Ethereum market has experienced a surprise surge in price over the past few trading days which totals almost 25%, bringing the current trading price up to around $122.49, at the time of writing.
The price increase occurred on February 8, 2019 when the market rose from a low around $105 to a high of $124.91.
Ethereum has now sailed past Ripple for the number 2 ranked position as it currently holds a $12.66 billion market cap valuation.
ETH/USD Price
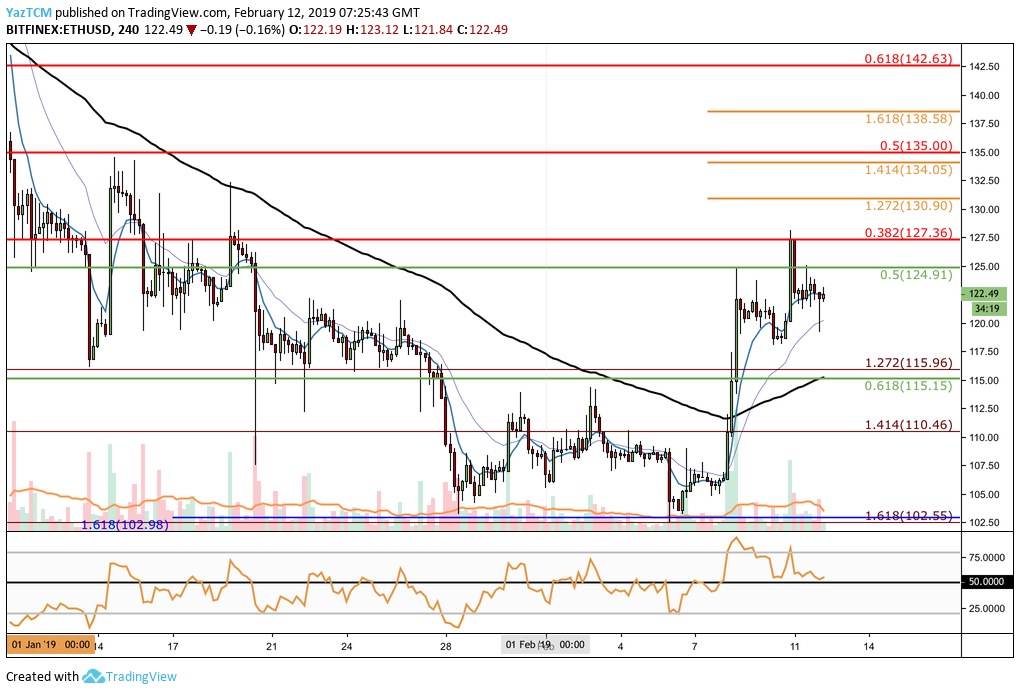
Taking a look at the ETH/USD 4HR chart above, we can see that the market had held at the support identified at the downside 1.618 Fibonacci Extension level (drawn in blue) priced at $102.98.
We can also see the surprise price surge occurring on February 8 as price action rose from $105 and rallied aggressively until it reached resistance at the short-term .5 Fibonacci Retracement level (drawn in green) priced at $124.91.
After reaching this level of resistance, the market pulled back slightly for a couple of days until the bullish rally drove price action higher.
The market rose into resistance provided by a bearish .382 Fibonacci Retracement level (drawn in red) priced at $127.36. This bearish Fibonacci Retracement level is measured from the high of $167 seen in January 2019 to the low of $102 seen earlier during the month of February 2019.
Price action has since slipped slightly lower as it currently trades around that $122.49 handle.
Trend: Bullish
The recent bullish surge has now rendered the market trading condition bullish. The break above $115 had created a higher higher and thus switched the market from bearish to bullish.
For this bullish trend to continue, we now will need price action to break above the $127 handle once again.
Where is the Market Likely to Head Towards Next?
If the bullish pressure can continue, we can expect immediate higher resistance to initially be located at the short-term bearish .382 Fibonacci Retracement level (drawn in red) priced at $127.36.
Higher resistance above can then be located at the short-term 1.272 and 1.414 Fibonacci Extension levels (drawn in orange) priced at $130.90 and $134.05, respectively. This is followed closely by resistance at the short-term bearish .5 Fibonacci Retracement level (drawn in red) priced at $135.
If the buyers can continue to climb above the $135 handle, there is higher resistance at the short-term 1.618 Fibonacci Extension level (drawn in orange) priced at $138.58, followed by resistance at the bearish .618 Fibonacci Retracement level (drawn in red) priced at $142.63.
What if the Bears Regain Control of the ETH/USD Market?
Alternatively, if the sellers step back into the market and begin to to push ETH/USD lower, we can expect immediate support beneath at the psychological support at the $120 handle.
Support below this can then be expected at the short-term .618 Fibonacci Retracement level (drawn in green) priced at $115.15 which is followed by more support at the medium-term downside 1.414 Fibonacci Extension level (drawn in red) priced at $110.46.
If the bears cause ETH/USD to break below $110, we can expect more support beneath at the previous short-term downside 1.618 Fibonacci Extension level (drawn in blue) priced at $102.98.
ETH/BTC Price
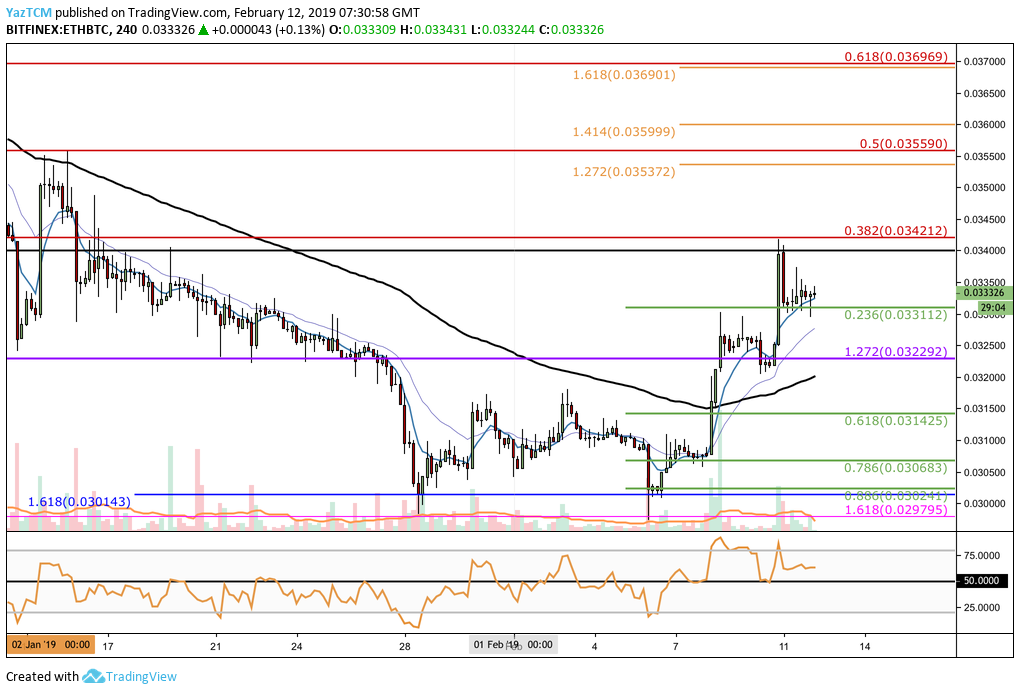
Since our last ETH/BTC analysis, we can see that the market had managed to hold above the short-term downside 1.618 Fibonacci Extension level (drawn in blue) priced at 0.030143 BTC.
Price action for Ethereum then surged significantly against Bitcoin by a total of 15% until resistance was reached at the bearish .382 Fibonacci Retracement level (drawn in red) priced at 0.0342121 BTC.
This bearish Fibonacci Retracement level is measured from the January 2019 high to the February 2019 low. The resistance in this region was also bolstered by the November 2018 high (drawn as a black line) which helped to slow the ETH/BTC surge.
Price action has since rolled over slightly, and is now trading at the short-term .236 Fibonacci Retracement level (drawn in green) priced at 0.033112 BTC.
Trend: Bullish
As the market has surged above the 0.0315 BTC handle, creating a higher high, the market can now be considered bullish. For this bullish trend to continue, price action needs to break above the 0.034212 BTC level.
Where is the Market Likely to Head Towards Next?
If the bulls cause ETH/BTC to climb higher, we can expect immediate higher resistance at the bearish .382 FIbonacci Retracement level (drawn in red) priced at 0.034212 BTC.
Further resistance towards the upside can then be found at the short-term 1.272 Fibonacci Extension level (drawn in orange) priced at 0.035372 BTC, closely followed by more resistance at the bearish .5 Fibonacci Retracement level (drawn in red) priced at 0.03559 BTC.
If the buyers continue to push ETH/BTC higher, more resistance can be expected at the short-term 1.414 and 1.618 Fibonacci Extension levels (drawn in orange), priced at 0.03599 BTC and 0.03690 BTC respectively.
What if the Sellers Drive ETH/BTC Price Action Lower?
Alternatively, if the sellers begin to push ETH/BTC below the current support at 0.03311 BTC, we can expect immediate support beneath located at the previous long-term downside 1.272 Fibonacci Extension level (drawn in purple) priced at 0.03229 BTC.
This is then followed by more support beneath at the short-term .618 and .786 Fibonacci Retracement levels (drawn in green), priced at 0.03142 BTC and 0.03068 BTC respectively.
The final level of support to highlight is located at the previous short-term downside 1.618 Fibonacci Extension level (drawn in blue) priced at 0.030143 BTC.
Conclusion
The recent price surge has helped to switch the sentiment for Ethereum from bearish to bullish. Before the surge, Ethereum was trading very close to the $100 handle which had many worried that price action might dip beneath $100 again.
However, the recent break above $115 has now turned this market bullish.
The next level of resistance for ETH/USD to challenge will be located at $127. If the bulls can break above this. we may see ETH continue to make its way higher towards the $150 level.