- BitTorrent has launched their own native BTT token.
- The token will be used to attain faster download speeds on their uTorrent client.
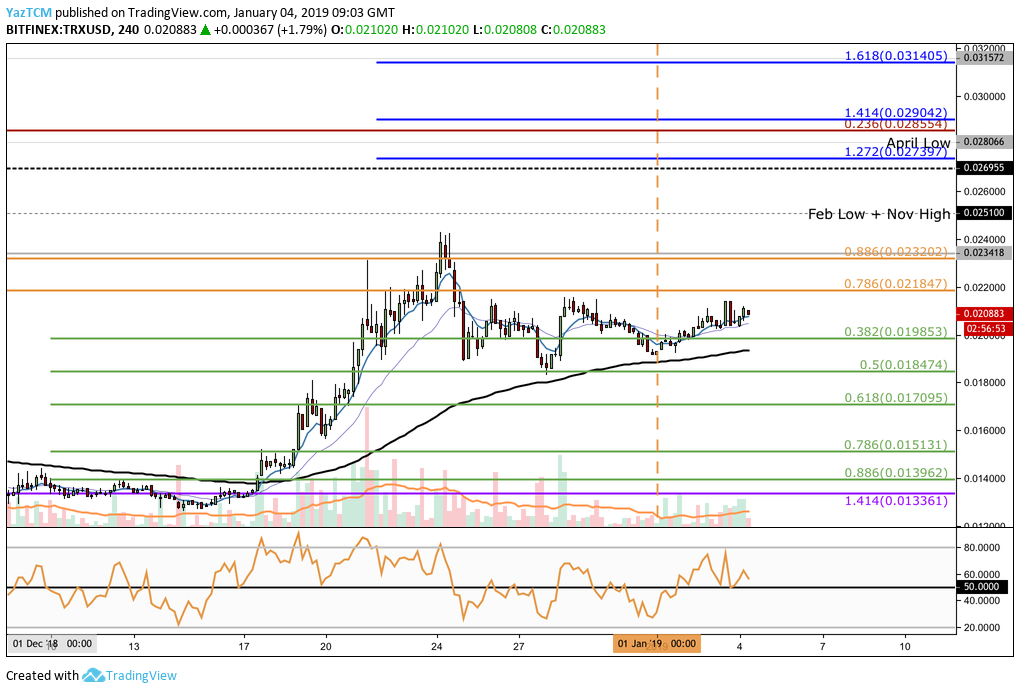
- Support moving forward: $0.01985, $0.01847, $0.01709, $0.01513, $0.01396, $0.01336.
- Resistance moving forward: $0.02184, $0.02320, $0.02510, $0.02739, $0.02904, $0.030, $0.03140.
Latest TRON News
After launching their new DEX platform and with an increased number of dapps migrating from Ethereum to the TRON network, the TRON train is chugging along with a more than satisfactory speed.
The company had bought the largest peer-to-peer Torrent client for an undisclosed amount over 6 months ago, giving birth to Project Atlas. BitTorrent has now announced they are launching their own native token on the TRON network.
The BitTorrent Token (BTT) will be a TRC-10 token on the TRON protocol. The token is designed so it can be exchanged between peer-to-peer users. With the token, users can optimize their network speed by providing more bandwidth, which in turn should allow them to receive faster download speeds.
BitTorrent boasts over 100 million users, so the BTT token will have a significant head start with such a large user base. The BTT token will first be implemented on the windows-based uTorrent Classic client, owned by BitTorrent, which is said to be their most widely-used program.
The token will be available to all non United States-based accounts, and will be distributed through the Binance Launchpad programme. The team has also stated that they will be conducting airdrops in the near future.
This brand new style of peer-to-peer torrenting is said to be the initial stages of a fresh new way for content creators to share information and files.
Let us continue to take a look at the TRX/USD market over the recent period and continue to highlight any potential areas of support and resistance moving forward.
TRX Price Analysis
TRON has seen a small 2.70% price increase over the last 24-hour trading period as the token now trades at a price around $0.02088, at the time of writing.
The cryptocurrency has seen a further 9.32% price increase over the past 7 trading days which extends to a much higher price surge totaling 42% over the past 30 trading days. This makes TRX the top performer over the past month within the top 10.
TRON is now ranked in 10th position and currently holds a $1.36 billion market cap value. However, the 16-month old project is still trading at a value that is 81% lower than the all-time high price so there is still a long road ahead to recovery.
Analyzing the market from the 4-hour chart above, we can see that since our last analysis, the TRX/USD market was able to hold above our expected support level at the short-term .5 Fibonacci Retracement level (drawn in green) priced at $0.01847.
After bouncing from this support, the market attempted to travel higher but met resistance above just shy of the $0.022 handle.
Trend: Bullish Above $0.24
The market is currently trading sideways, and has been since Christmas Day.
However, the short-term trend remains bullish unless the sellers manage to push price action below the $0.018 handle. This would cause the market to change back to its bearish trend.
A break above the $0.024 handle would confirm that the bullish trend will continue to cause TRX/USD to travel higher.
Where Will TRX Meet Resistance Towards the Upside?
If the bulls can continue to gather momentum and begin pushing price action higher, we can expect immediate higher resistance to be located at the bearish .786 and .886 Fibonacci Retracement levels (drawn in orange), priced at $0.02184 and $0.02320 respectively.
This Fibonacci Retracement is measured from the November 2018 high to the December 2018 low.
If the buyers can continue to travel higher and penetrate above the December 2018 high at $0.024, further higher resistance can be located at the February 2018 low priced at $0.02510. This is followed by the short-term 1.272 and 1.414 Fibonacci Extension levels (drawn in blue), priced at $0.02739 and $0.02904 respectively.
The final level of resistance in the short term to highlight is located at the 1.618 Fibonacci Extension level (drawn in blue) priced at $0.031040.
Where is the Support Located Below $0.020?
If the sellers regain control of the market momentum and drive price action below the $0.020 handle, we can expect further support toward the downside to be located at the short-term .382 and .5 Fibonacci Retracement levels (drawn in green), priced at $0.01985 and $0.01847 respectively.
Further support below this can then be expected at the short-term .618 and .786 Fibonacci Retracement levels (drawn in green), priced at $0.01709 and $0.01513 respectively.
What are the Technical Indicators Showing?
The RSI has managed to break above the 50 handle and stay above on the 4-hour time frame, indicating that the bulls still possess the momentum in the short term.
However, if the RSI does break below the 50 handle, we could see price action heading back below the $0.020 handle.
Conclusion
It will be extremely interesting to see how Project Atlas and the BTT token unfolds. If BitTorrent can capture even a small proportion of the audience and convince them to use the BTT token for faster downloads, then the token will have a strong utility case which in turn should help its price increase significantly.


