
- TRON has recently surpassed the 1 million accounts threshold.
- The market is trading at support provided by a short-term .5 Fibonacci Retracement.
- Support moving forward: $0.01847, $0.01709, $0.01513, $0.01484, $0.01396, $0.01336, $0.01123.
- Resistance moving forward: $0.01985, $0.020, $0.02184, $0.02320, $0.02510, $0.02739, $0.02904.
Latest TRON News
Recently, we reported that the TRON network had surpassed the 900K mark in terms of the number of accounts created. Since then, the rate of TRX adoption has not slowed down — as of December 23, 2018, the TRON network had hit the major milestone of reaching 1,000,000 (yes 1 million!) accounts within 184 days.
In comparison, Ethereum had taken a total of 542 days to reach the 1 million account threshold. The TRON network had taken an extraordinary 358 days less to reach this goal.
Congratulations on #TRON mainnet accounts surpassed 1 Million in 184 days. #TRX $TRX pic.twitter.com/mjGYuRv7aV
— Justin Sun (@justinsuntron) December 24, 2018
As a celebration for the holidays, TRXMarket (TRON’s decentralized exchange) announced that there would be officially zero transaction fees on trades on the exchange:
The best Christmas gift from #TRXMarket 🎁🎁
0 transaction fee on #TRXMarket has really come true!!
Go trading: https://t.co/tflRhfOusM #TRON $TRX @justinsuntron @Tronfoundation https://t.co/7tfh5nYyvB— TRXMarket (@TRX_Market) December 26, 2018
In other TRON news, the team, along with Binance, has donated $100,000 each in cryptocurrency to the Malta Community Chest Fund Foundation, through the Binance Charity Foundation. This is in aid of underprivileged residents of the country, and shows that that blockchain can be used for good social reasons.
Furthermore, Binance has also recently announced that it will be adding TRX to its exchange, alongside the brand new base pair XRP, to create the TRX/XRP market.
Let us continue to analyze price action for TRX/USD and highlight any potential areas of support and resistance.
TRX Price Analysis
TRON has seen a price fall over the past 24 hours of trading which totals 6.64%, bringing the current trading price for the cryptocurrency to around $0.01877, at the time of writing.
The cryptocurrency has seen a 1.09% price increase over the past 7 trading day,s and a further rather significant 55% price surge throughout the past 30-day trading period.
TRON continues to sit comfortably in 10th position as it retains a $1.24 billion market cap value. However, the 15-month old project still has a long way to recover as it currently is trading at a value that is 92% lower than the all-time high price.
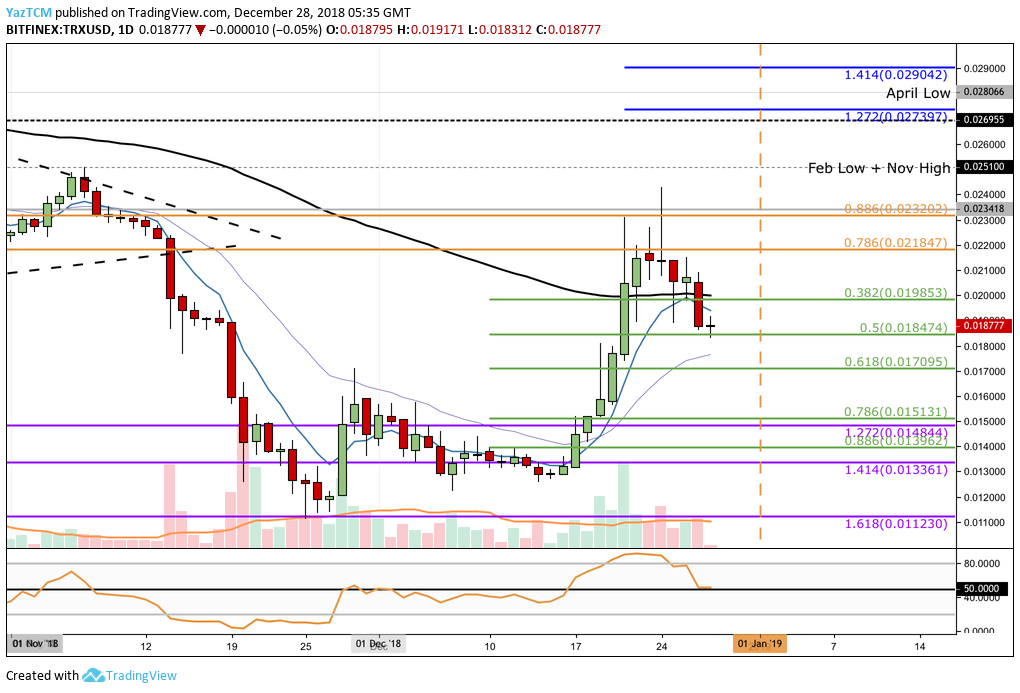
Taking a look at TRX/USD from the daily timeframe above, we can see that after reversing at the downside 1.618 Fibonacci Extension level (drawn in purple) priced at $0.01123 during late November 2018, the market proceeded to rally aggressively.
Price action for TRX/USD had stalled at the bearish .786 FIbonacci Retracement level (drawn in orange) priced at $0.02184 before reversing and falling slightly. The bearish Fibonacci Retracement is measured from the high to low witnessed during November 2018.
Tron is now trading at support provided by the short-term .5 FIbonacci Retracement level (drawn in green) priced at $0.01847.
Trend: Bullish Above $0.24
The market had seen a short-term bullish run during mid-December, but has since stalled and retraced slightly.
For this bullish run to continue, we would need to see TRX/USD break cleanly above the $0.024 handle to travel higher. For the long-term bearish cycle to continue within TRX/USD, we would need to see the market break below the November 2018 low priced around $0.011.
At this moment in time, the market is in a phase of consolidation as the market continues to retrace.
Where is the Support for TRX Below the $0.01874 Support?
If the bears continue to push price action below the support at the short-term .5 Fibonacci Retracement level (drawn in green), we can expect further support beneath to be located at the short-term .618 and .786 Fibonacci Retracement levels (drawn in green), priced at $0.01709 and $0.01513 respectively.
If the sellers continue to pressure price action below $0.015, more support can be located at the .886 Fibonacci Retracement level (drawn in green) priced at $0.01396. This is closely followed by the downside 1.414 Fibonacci Extension level (drawn in purple) priced at $0.01336.
Where is the Resistance for TRX Towards the Upside?
If the bulls can hold the support at $0.01874, we can expect immediate resistance toward the upside to be located at the short-term .382 Fibonacci Retracement level (drawn in green) priced at $0.01985.
If the buying pressure continues to push the market above $0.02, we can expect more resistance to then be located at the bearish .786 and .886 Fibonacci Retracement levels (drawn in orange), priced at $0.02184 and $0.02320 respectively.
If the buyers can continue to climb above $0.024, they will encounter further resistance at the February 2018 price low at $0.02510. This is followed by the short-term 1.272 and 1.414 Fibonacci Extension levels (drawn in blue), priced at $0.02739 and $0.02904 respectively.
What Are the Technical Indicators Showing?
The RSI has flatlined at the 50 handle which indicates that neither the bulls nor the bears are in control of the market momentum as the players wait to see which direction the market heads towards next.
If the RSI breaks below the 50 handle, we could see TRX/USD breaking below the support at $0.018 and heading further lower.
Conclusion
TRON hitting the 1 million account threshold in such a short time span is a huge achievement. The market is now in a state of indecision as we wait for the next direction of movement to be established.