
Bitcoin has broken above significant resistance above $5,500, after the coin saw a 5% price hike over the past 24 hours. Bitcoin is now trading at a price of $5,536, at the time of writing, after seeing a 37.5% price surge over the past 30 days of trading.
In the first half of April 2019, we wrote an article to discuss whether Bitcoin could hit $6,000 during April. After the break above $5,5000, Bitcoin nears closer to the $6,000 level with over a week still left within the month.
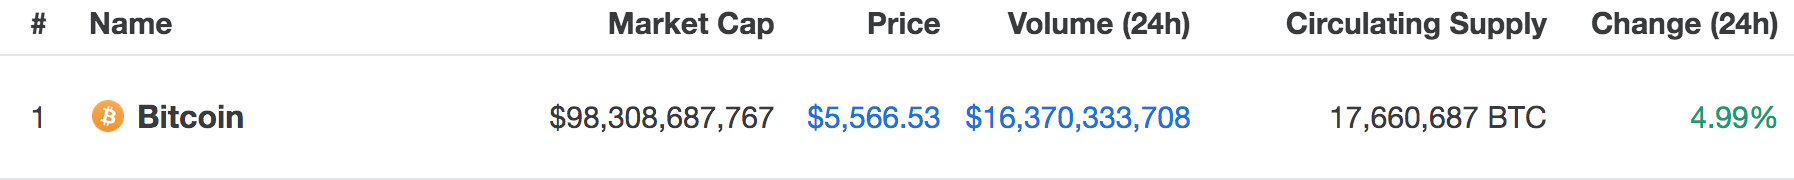
The recent price surge has now also allowed Bitcoin to re-approach the $100 billion market cap value. Bitcoin currently holds a $98.32 billion market cap, as the 72 month old project now trades at a value that is -71% lower than the previous all time high price.
If Bitcoin can continue to climb higher and break above the $6,000 level, we believe the next stop at resistance will be around the $6,150 level. Let us take a look at the Bitcoin market and highlight some potential areas of support and resistance moving forward.
Bitcoin Price Analysis
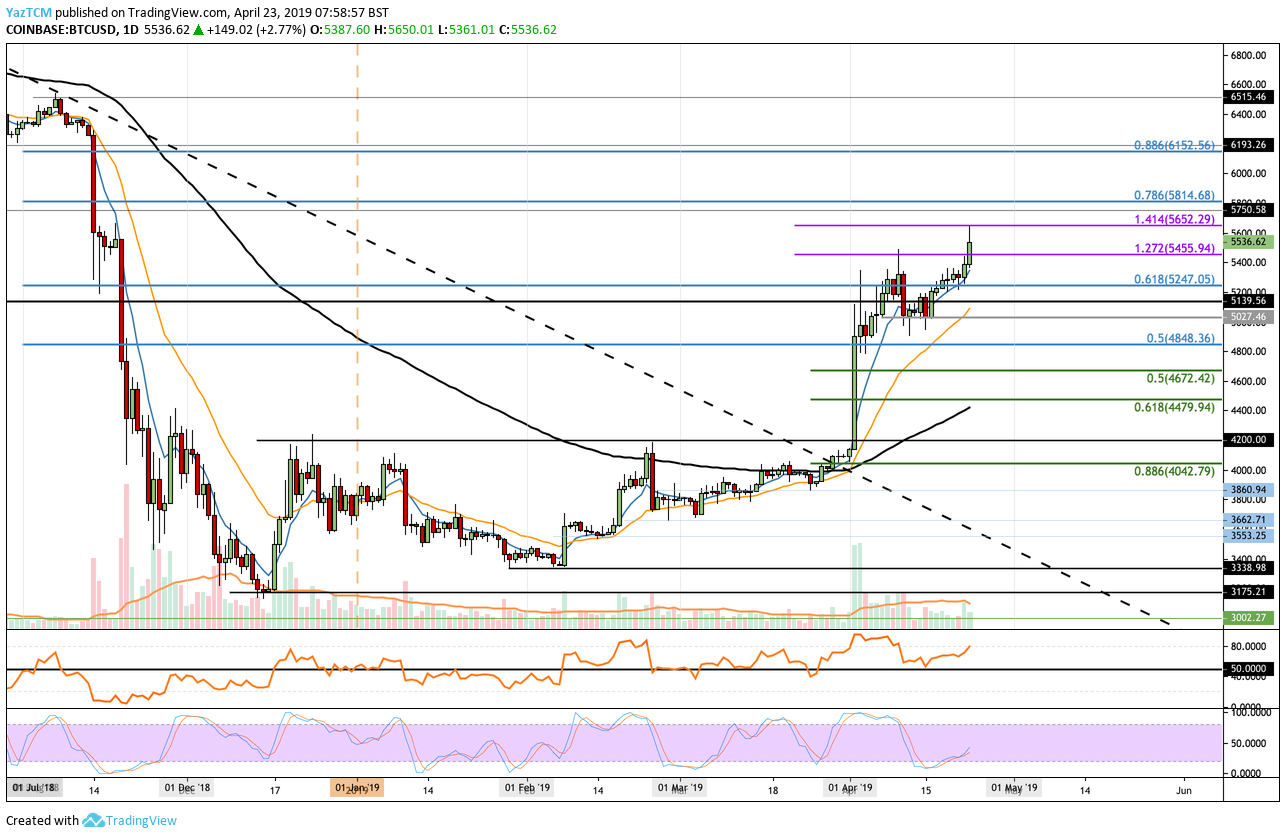
BTC/USD – MEDIUM TERM – DAILY CHART
What Has Been Going On?
Taking a look at the daily chart above, we can see that ever since Bitcoin broke above the 100-day moving average level, toward the end of March 2019, the market has continued to soar higher. At the same time, the market also broke above a very long-term descending trend line, which also helped propel Bitcoin further higher.
We can see that the recent price surge has now caused Bitcoin to head into higher resistance at a short-term 1.414 Fibonacci Extension level (drawn in purple), priced at $5,652. The market has pulled back slightly from this resistance to trade at a value of $5,536.
What Is the Short-Term Trend?
The current short-term trend remains bullish at this moment in time. For the short-term bullish trend to be invalidated, we would need to see BTC/USD fall and break beneath the $5,000 support level.
NOTE: Although Bitcoin may be in a short-term bullish trend, the long term outlook for Bitcoin still remains neutral. After such a long bearish trend, which has been in action since January 2018, it will be difficult for the long term outlook to turn bullish quickly. Instead, most analysts believe that, in traditional markets, we will not be out of the previous ‘bear market’ until the asset has surpassed a value that is 2x from the bottom. In the case of Bitcoin, this would require BTC/USD to break above the $6,400 level, if we take the $3,200 as the bottom of the previous bear market.
Where Is the Resistance On the Way To $6,150?
If the bullish pressure continues to cause BTC/USD to rise further higher and break above the current resistance at $5,652, we can expect immediate resistance above to be located at the bearish .786 Fibonacci Retracement level (drawn in blue), priced at $5,814. This long-term bearish Fibonacci Retracement level is measured from the November 2018 high, before the November 2018 bloodbath, to the December 2018 price low.
Above $5,814, higher resistance is then to be expected at the psychological round number at $6,000. If the buyers are successful in overcoming the resistance at $6,000, we can then expect higher resistance to be located at the bearish .886 Fibonacci Retracement level (drawn in blue), priced at $6,152. This is where we believe the next level of significant resistance will lie if BTC/USD manages to break above $6,000.
Above $6,152, the next level of resistance will then be expected at the November 2018 high at the $6,515 level.
What If the Sellers Resume Control?
Alternatively, if the sellers step back in and start to push price action lower, we can expect immediate support to be located at the previous bearish .618 Fibonacci Retracement level priced at $5,247. Support beneath this then lies at $5,139 and $5,000.
If the bearish pressure continues to drive BTC/USD below $5,000, we can then expect more support to be located at $4,848 and $4,672.
What Are the Technical Indicators Showing?
The RSI has recently bounced at the 50 level, which indicates that the bulls have managed to maintain the momentum within in the market. The RSI still has room to travel higher before reaching “overbought” conditions, which indicates that Bitcoin could potentially be making a run toward $6,000 in the coming days.
Furthermore, the Stochastic RSI has recently initiated a crossover above signal in oversold territory, which indicates that the bullish momentum is just starting and more buying should be incoming.