
Bitcoin has been on a serious tear over the past month after rising by a total of 33%, bringing the current price to around $5214. The cryptocurrency had started the month by climbing above the 100 day moving average and also breaking above an 11 month old descending trend line. After breaking above these two levels of resistance, the market continued to surge further higher into the $5200 region.
Despite dropping by 1% over the past 24 hours, Bitcoin is still up by a total of 4% on the week. The 71 month old cryptocurrency godfather now holds a market cap value of $92 billion as it continues to make its way back to toward the elusive $100 billion market cap level.
In this article, we will take a look at the chances for Bitcoin to reach the $6000 level before the end of April. We will highlight some of the major resistance levels on the way up toward $6000 and also highlight some support if the market reverses and heads lower.
Bitcoin Price Analysis
BTC/USD – MEDIUM TERM – DAILY CHART
What Has Been Going On?
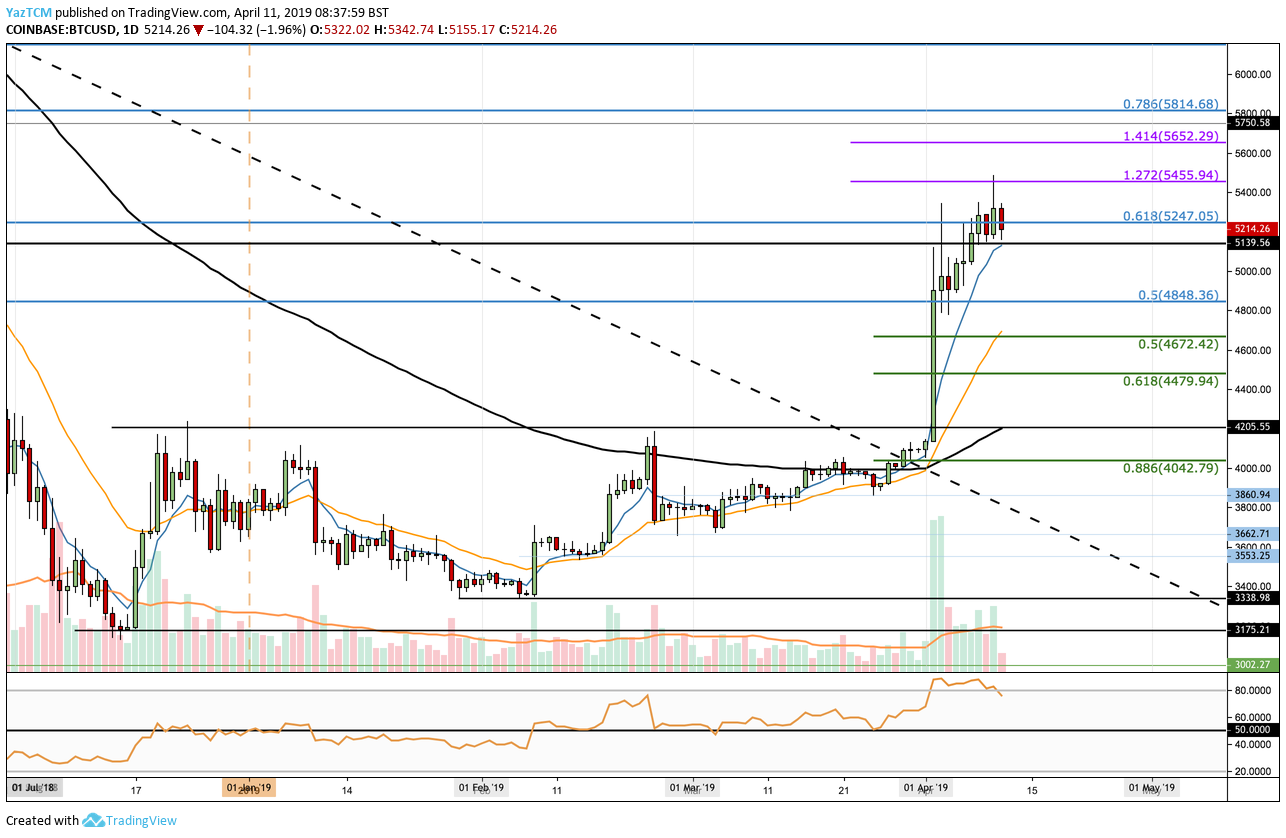
Taking a look at the BTC/USD chart above we can clearly see the break above the long term descending trend line and above the 100 day moving average at the start of April 2019. The market then proceeded to rally aggressively after this moment, surging into resistance at the bearish .618 Fibonacci Retracement level (drawn in blue) priced at $5247. This bearish Fibonacci Retracement is measured from the November 2018 high to the December 2018 low.
In the most recent trading session, we can see that BTC/USD had managed to spike further higher into resistance above at a short term 1.272 Fibonacci Extension level (drawn in purple) priced at $5455. However, the market was unable to sustain itself at this level and proceeded to roll over back into the $5200 region.
The current short term trend remains bullish until the market dictates otherwise. For the bullish trend to continue we would need to see BTC/USD climb back into the $5455 region. If Bitcoin was to fall beneath the $4800 level, this bullish trend would become invalidated.
Where Is The Resistance On The Way Up Toward $6000?
If the buyers can continue to cause BTC/USD to climb further higher, we can expect immediate resistance above to be located at the previous 1.272 Fibonacci Extension level (drawn in purple) priced at $5247. Above this, further resistance then lies at the 1.414 FIbonacci Extension level (drawn in purple) priced at $5652.
If the bulls continue to drive BTC/USD higher, further resistance above is then expected at the $5750 level followed with resistance at the bearish .786 Fibonacci Retracement level (drawn in blue) priced at $5814.
IF the bullish pressure can cause BTC/USD to break above $5814, the buyers will be clear to then make an attempt at the $6000 level. Above $6000, resistance can then be located at the bearish .886 Fibonacci Retracement level priced at $6152.
What If The Sellers Regain Control?
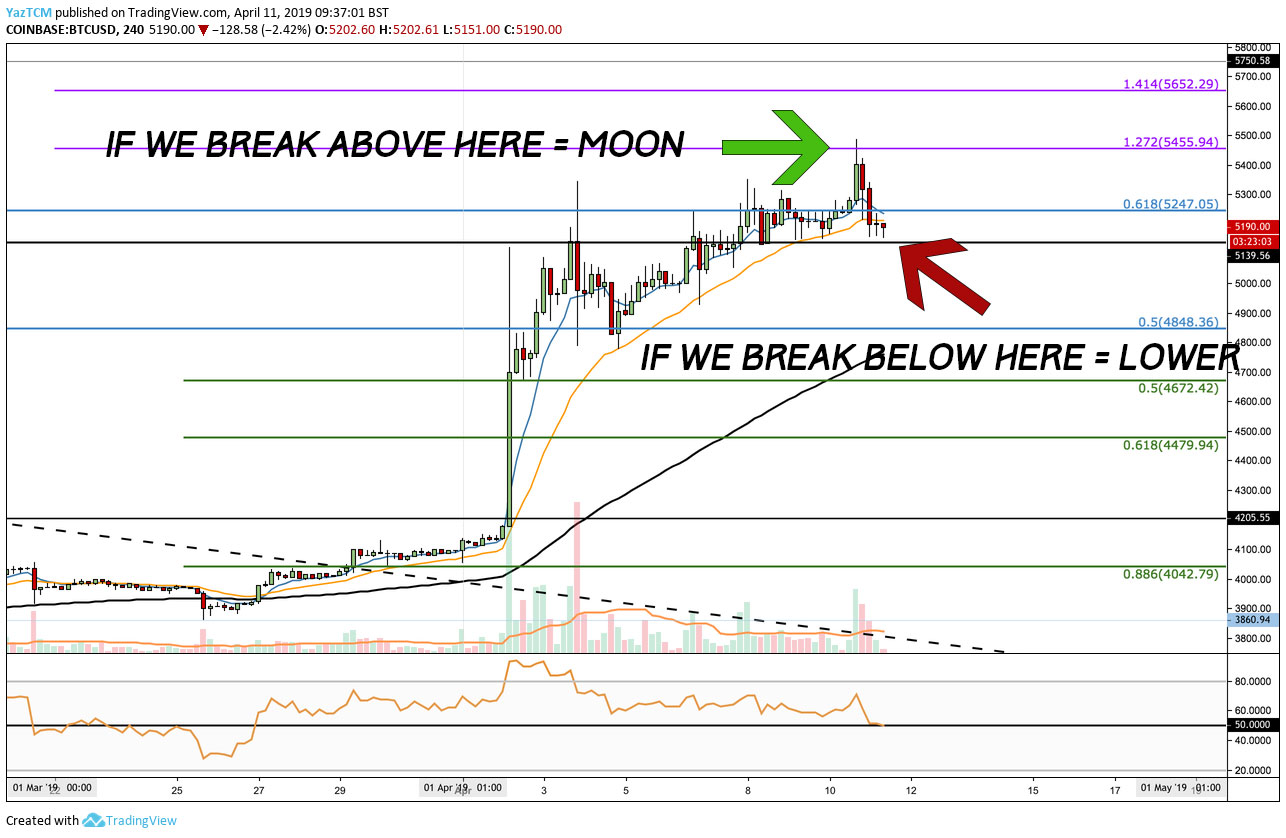
Alternatively, taking a look at the 4HR chart above, if the sellers regroup and begin to push the market lower we can expect immediate support toward the downside to be located at $5140 and $5000.
If the sellers continue beneath $5000, more support below can be expected at the previous bearish .5 Fibonacci Retracement level (drawn in blue) priced at $4848. Beneath this, more support then lies at the short term .5 and .618 Fibonacci Retracement levels (drawn in green) priced at $4672 and $4479, respectively.
If the sellers continue to drive BTC/USD beneath $4400, we can then expect more strong support at $4200 where lies the 100 day moving average (on the daily chart above), adding further strength to the support in this area.
What Are The Technical Indicators Showing?
After reaching the highest RSI reading since January 2018, the RSI has recently just broken below the 80 level overbought threshold level and looks to be heading lower. If the RSI continues to fall, we can expect price action to follow suit as the bullish momentum will be fading.
Conclusion
Bitcoin certainly has a strong chance to reach the $6000 before the month closes. The market will still need to clear strong resistance around $5455 and $5814 before being able to accomplish this. However, if the RSI continues to fall further lower we can expect price action to reverse and head into support beneath the $5000 level.