
- Analysts at JP Morgan believe Bitcoin may fall to $1,250.
- 58% of financial advisors would invest in a Bitcoin ETF.
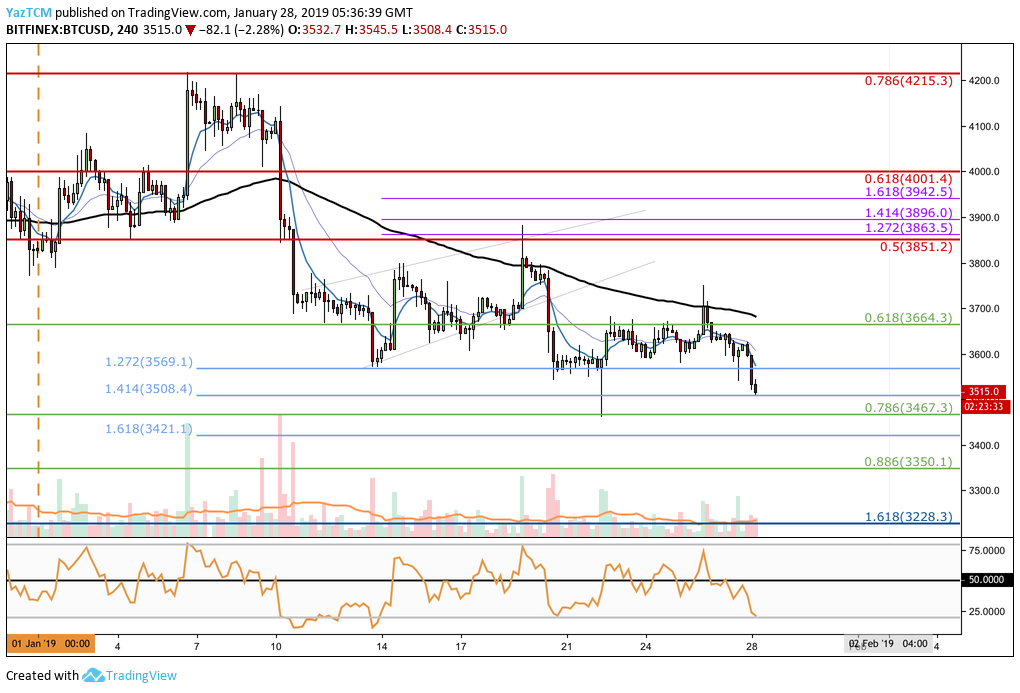
- Support moving forward: $3,508, $3,467, $3,421, $3,400, $3,350, $3,300, $3,228.
- Resistance moving forward: $3,559, $3,600, $3,664, $3,800, $3,851, $3,896, $3,942, $4,001, $4,215.
Latest Bitcoin News
A new report by analysts at JP Morgan Chase has revealed that they believe Bitcoin could fall to as low as $1,250 this year. Moreover, they believe that Bitcoin will not make a big impact on the banking industry for at least 3-5 years.
In other Bitcoin news, a new Bitwise survey found that around 58% of investors would invest in a Bitcoin ETF, if it was available. Currently, the lack of clarity on cryptocurrency regulations is one of the main factors holding back financial advisors from investing in Bitcoin.
BTC Price Analysis
Bitcoin has seen a 2.95% price decline over the past 24 hours of trading, bringing the current trading price down to around $3,515, at the time of writing. BTC has now seen a 2.71% price drop over the past 7 trading days, with a further 10.32% price fall over the past 30 trading days. It has now seen a significant 44% price plummet over the past 90 trading days.
Bitcoin currently holds a $61.15 billion market cap value, and has seen an increase in volume of up to $5.92 billion over the past 24 hours of trading.
BTC/USD Price
What Has Happened Since Our Last Analysis?
Since our last analysis on Bitcoin, BTC has made some price movements in both directions.
After bouncing from the support at the short-term downside 1.272 Fibonacci Extension level (drawn in blue) priced at $3,569, the market went on to rally and even broke above resistance at the short-term .618 Fibonacci Retracement level (drawn in green) priced at $3,664 to reach a high of $3,750.
However, after rolling over at $3,750, BTC/USD dropped back below the short-term .618 Fibonacci Retracement level (drawn in green) priced at $3.664. It has continued to fall even further below the short-term downside 1.272 FIbonacci Extension level (drawn in blue) priced at $3,569.
Price action has now reached further support at a short-term downside 1.414 FIbonacci Extension level (drawn in blue) priced at $3,508.
Trend: Bearish
The recent break below the support at the short-term downside 1.272 Fibonacci Extension level (drawn in blue) priced at $3,569 has now rendered the short-term market trend bearish.
For this market to now be considered bullish, we would need to see a clean and sustained break above the $3,750 handle.
Where is BTC Likely to Head towards Next?
If the bearish pressure continues to drive price action for BTC/USD below the current support at the short-term downside 1.414 Fibonacci Extension level (drawn in blue) priced at $3,508, we can then expect further support below to be located at $3,500.
If the market collapses below $3,500, immediate support below is located at the short-term .786 Fibonacci Retracement level (drawn in green) priced at $3,467. This support is closely followed by more support at the short-term downside 1.618 Fibonacci Extension level (drawn in blue) priced at $3,421.
If BTC/USD falls below the $3,400 handle, there is further support towards the downside at the short-term .886 Fibonacci Retracement level (drawn in green) priced at $3,350. This is closely followed by more support at the previous long-term downside 1.618 Fibonacci Extension level (drawn in dark blue) priced at $3,228.
What if the Bulls Hold at $3,508?
If the bulls can defend the $3,508 handle (or at further support at the short-term .786 Fibonacci Retracement level at $3,467) and cause the market to reverse and head higher, we can expect immediate resistance towards the upside to be located at the previous short-term downside 1.272 Fibonacci Extension level (drawn in blue) $3,569.
If price action goes above $3,600, there is higher resistance at the short-term .618 Fibonacci Retracement level (drawn in green) priced at $3,664.
More resistance towards the upside can then be expected at the bearish .5 Fibonacci Retracement level (drawn in red) priced at $3,851. This bearish FIbonacci Retracement is measured from the high seen during November 2018, before the market bloodbath, to the low set in December 2018.
If the buyers continue to push price action higher, more resistance is located at the short-term 1.414 and 1.618 Fibonacci Extension levels (drawn in purple), priced at $3,896 and $3,942 respectively. This is then closely followed by resistance at the bearish .618 Fibonacci Retracement level (drawn in red) priced at $4,001.
What are the Technical Indicators Showing?
The RSI has approached oversold conditions on the 4-hour chart which could indicate that the bears may be “exhausted” at this moment in time.
In this case, a small pull back higher would be expected. However, the recent break below the support at $3,569 has caused the sentiment to change so we can easily expect price action to head lower.
Conclusion
We expect Bitcoin to continue to keep falling until it reaches support at the short-term .786 Fibonacci Retracement level (drawn in green) priced at $3,467. If the sellers push price action below this level of support, then Bitcoin may be on its way to creating fresh long-term lows once again.