
- CNBC contributor Brian Kelly believes that the bear run is nearly over.
- Bitcoin is now re-approaching critical support at the $3,569 handle.
- Support moving forward: $3,569, $3,508, $3,467, $3,421, $3,350, $3,228.
- Resistance moving forward: $3,664, $3,700, $3,800, $3,851, $3,896, $3,942, $4,001, $4,215, $4,342.
Latest Bitcoin News
CNBC contributor Brian Kelly alluded to his bullish sentiment on Bitcoin in a recent interview. Kelly believes that Bitcoin is somewhere close to the end of the current bear market. However, he stated that he believes there is a possibility for one more leg down before the bear trend will reverse.
He also expressed that he does not believe that a Bitcoin ETF will be approved in 2019.
In other Bitcoin news, Jerry Young, the co-founder of Yahoo, believes that the industry is at a “critical juncture”, following the rapidly falling hype surrounding Bitcoin and blockchain technology. That said, he does think that blockchain has an important application for the future of banking and finance.
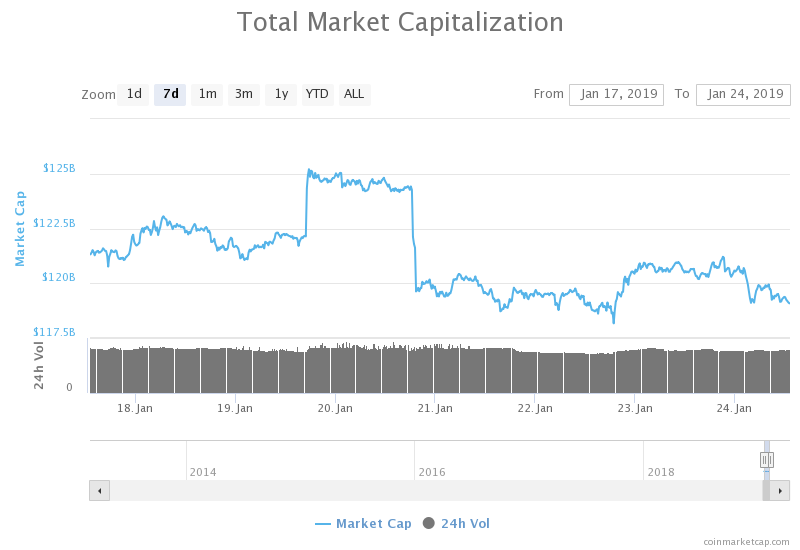
The current total market cap for the entire cryptocurrency industry (all cryptocurrencies including Bitcoin) is sitting around the $119 billion mark, after slipping from a high of around $124 billion earlier during the week.
Let us continue to take a look at price action for Bitcoin over the recent period and highlight some potential areas of support and resistance moving forward.
BTC Price Analysis
Bitcoin has fallen by a small 0.85% over the past 24 hours of trading, bringing the current trading price down to around $3595, at the time of writing. Over the past 7 trading days, price has fallen by 1.80% and there has been a larger 13.42% price drop over the past trading month.
BTC is now trading at a level that is 81% lower than its all-time high price.
Bitcoin now holds a $62.54 billion market cap valuation, slightly lower than the market cap value in our last BTC/USD analysis article.
BTC/USD Price
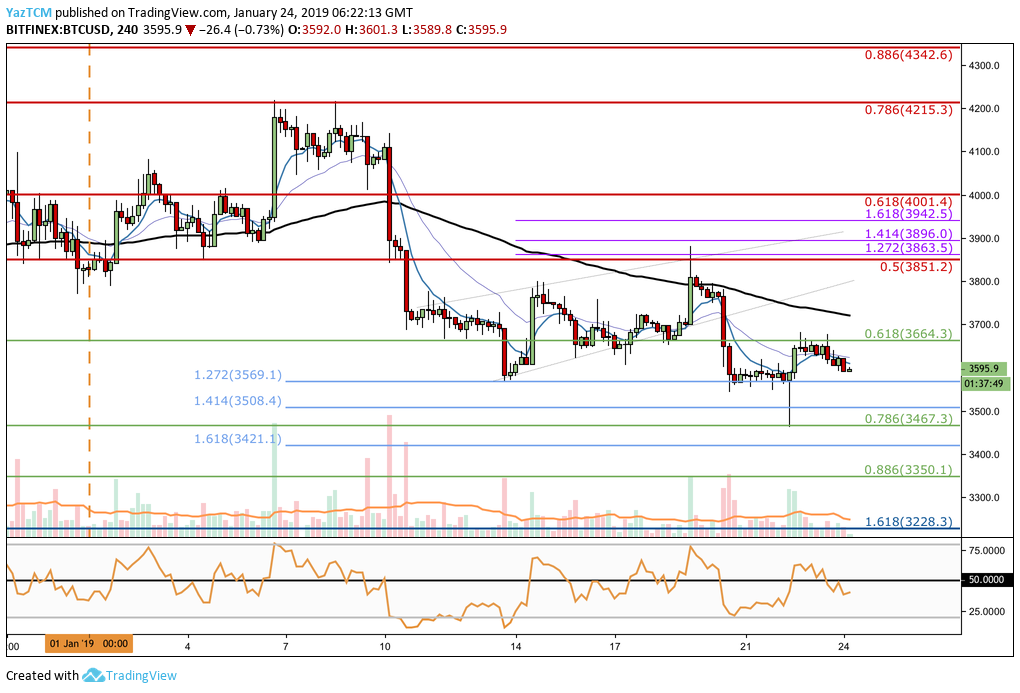
Analyzing price action from the 4-hour chart above for BTC/USD, we can see that price action had rebounded from the previously identified support at the short-term downside 1.272 FIbonacci Extension level (drawn in blue) priced at $3,569.
The market then went on to rally slightly, pushing price action for BTC/USD into resistance at the short-term .618 Fibonacci Retracement level (drawn in green) priced at $3,664. The market was unable to overcome this level of resistance and proceeded to decline once again.
Right now, Bitcoin is trading at $3,595 and looks to be heading toward support at the $3,569 handle once again. Hopefully, the bulls can defend this location to prevent price action from slipping further beneath.
Trend: Neutral
The market is still neutral at this moment in time. However, if price action does fall below the $3,569 handle, we can expect price action to fall much further.
For this market to be considered bullish, we would need to see price action break above the $3,900 handle.
Where is the Support Beneath the Current Market Price?
If price action continues to fall for BTC/USD, we can expect immediate support to be located at the previously highlighted downside 1.272 Fibonacci Extension level (drawn in blue) priced at $3,569.
If the sellers continue to push BTC/USD below this level of support, further support below is located at the short-term downside 1.414 FIbonacci Extension level (drawn in blue) priced at $3,508. There is also more support at the short-term .786 Fibonacci Retracement level (drawn in green) priced at $3,467.
If BTC goes below the $3,467 handle, more support below can then be expected at the short-term downside 1.618 FIbonacci Extension level (drawn in blue) priced at $3,421. This is closely followed by more support at the short-term .886 Fibonacci Retracement level (drawn in green) priced at $3,350.
The final level of support to highlight is located at the previous long-term downside 1.618 FIbonacci Extension level (drawn in dark blue) priced at $3,228.
Where is the Resistance Above the Market?
Alternatively, if the bulls regroup and begin to push price action higher, we can expect immediate resistance above to be located at the short-term .618 Fibonacci Retracement level (drawn in green) priced at $3,664.
If BTC/USD climbs above $3,800, higher resistance can be expected at the bearish .5 Fibonacci Retracement level (drawn in red) priced at $3,851. This is closely followed by more resistance at a short-term 1.414 and 1.618 Fibonacci Extension level (drawn in purple), priced at $3,896 and $3,942 respectively.
More resistance towards the upside is expected at the bearish .618 Fibonacci Retracement level (drawn in red) priced at $4,001.
If the buyers can cause BTC/USD to break higher from $4,001, expect more resistance at the bearish .786 and .886 Fibonacci Retracement levels (drawn in red), priced at $4,215 and $4,342 respectively.
What are the Technical Indicators Showing?
The RSI on the 4-hour chart has recently slipped back below the 50 handle which indicates that the bears have regained control of the market momentum.
If the RSI continues to head further below the 50 handle, then we could expect BTC/USD to break the crucial support at the $3,569 handle.
Conclusion
Bitcoin is certainly at a critical juncture as it re-approaches the support at $3,569. The bulls will need to defend this area with all their might if they want to stop BTC/USD from slipping lower and creating fresh 2019 lows.