
- Support for BTC moving forward: $3,421, $3,400, $3,350, $3,331, $3,284, $3,228, $3,000.
- Resistance for BTC moving forward: $3,467, $3,508, $3,569, $3,664, $3,800, $3,851, $4,001.
Latest Bitcoin News
Bitcoin has faced another turbulent couple of days as prices tumble back towards the $3,421 handle once again. The market is now positioned to create the longest consecutive bearish month in the cryptocurrency’s history if price action finishes the 7th consecutive month in bearish territory.
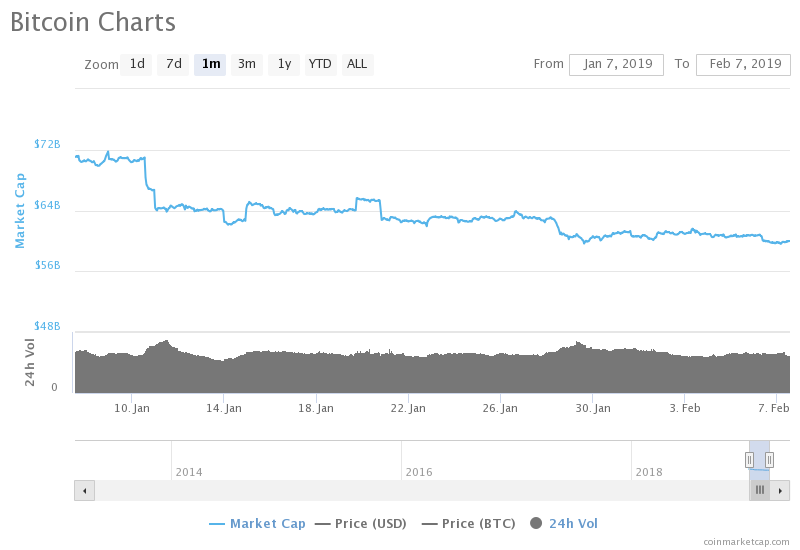
The past day has seen Bitcoin’s market cap tumble below $60 billion mark once again as investors continue to fear that Bitcoin may continue to make fresh troughs beneath the 2018 price low at around $3,228.
Many prominent analysts believe that the bearish nature of the market will continue over the next few months as institutional investors continue to remain on the sidelines before investing.
However, they are equally confident that the institutions will enter the market at some point, perhaps when the SEC give more of an indication that they are willing to accept the proposed Bitcoin ETFs that have constantly been rejected over the past year or so.
Bitcoin Price Analysis
Bitcoin has seen further price declines over the past 7 trading days totaling 1.82% as the market now trades around the $3,451 handle, at the time of writing. The cryptocurrency has now seen a 15% price fall over the past 30 trading days, with a further 47% price plummet over the past 90 trading days.
BTC/USD Price
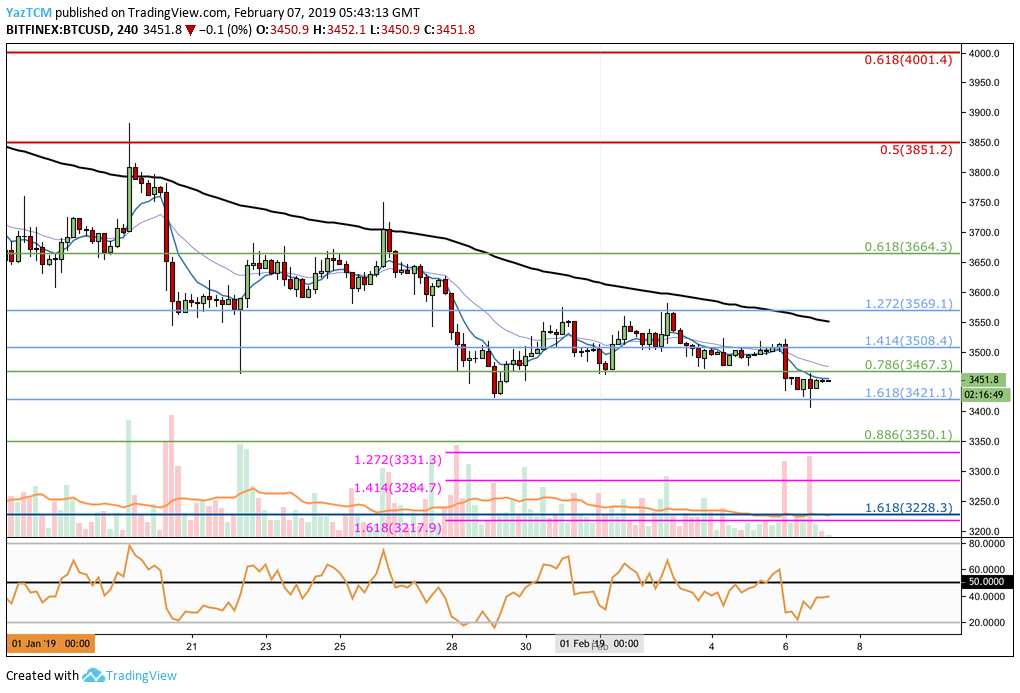
Since our last Bitcoin price analysis, we can see that the market has fallen lower and broken below the lower boundary of our previously highlighted trading range which had been established during early-February 2019 trading.
Price action had began to fall on February 6, 2019 as it slipped from a high of $3,521 and fell below the lower boundary of the range at the short term .786 Fibonacci Retracement level (drawn in green) priced at $3,467.
The market then continued to fall even lower over the following few hours as it spiked down toward the $3,405 region. However, we can see that the strong support at the short-term downside 1.618 Fibonacci Extension level (drawn in blue) priced at $3,421 had held as price action managed to close that period above the support level.
The market is now trading sideways around the $3,450 handle.
Trend: Bearish
As the market has slipped below the lower boundary of our previously identified trading range at $3,467, we can assume that the trading condition is now bearish.
If the market continues further lower and breaks below the support at $3,421, then we can expect price action to continue to head further lower into the 2018 lows around $3,228.
For this market to be considered bullish, we would need to see price action rise and break above the $3,569 handle.
Where is the Market Likely to Head Towards Next?
The recent break below $3,467 will cause further uncertainty in regards to the sentiment within the market which could lead to further declines.
If the sellers continue to drive price action lower and manage to penetrate below the support at the short-term downside 1.618 Fibonacci Extension level (drawn in blue) priced at $3,421, we can then expect further support beneath to immediately be located at the $3,400 handle.
If the bearish pressure drives price action below the $3,400 handle, we can look for support beneath at the short-term .886 Fibonacci Retracement level (drawn in green) priced at $3,350. This is closely followed by more support at the short-term downside 1.272 and 1.414 Fibonacci Extension levels (drawn in pink) priced at $3,331 and $3,284, respectively.
If the sellers push the market even lower, there is more strong support beneath at the previous long-term downside 1.618 Fibonacci Extension level (drawn in blue) priced at $3,228. This support had caused the 2018 price decline to reverse during mid-December 2018, and therefore is expected to provide strong support heading forward.
If the market does slip below the support at $3,228, we could then see price action heading further lower and could penetrate below the $3,000 handle for the first time since August 2017.
What if the Bulls Can Continue to Hold at $3,421?
Alternatively, if the buyers can manage to hold the support at the $3,421 and begin to climb higher, they will meet immediate resistance above at the short-term .786 Fibonacci Retracement level (drawn in green) priced at $3,467.
Further resistance above this can then be expected at the previous short-term downside 1.414 and 1.272 Fibonacci Extension levels (drawn in blue) priced at $3,508 and $3,568, respectively. This is then followed by more resistance at the short-term .618 Fibonacci Retracement level (drawn in green) priced at $3,664.
What are the Technical Indicators Showing?
The RSI on the 4HR chart has recently rebounded from oversold conditions and is now on the rise. This could be indicating that the bearish momentum is losing strength.
However, for a recovery to occur, we would need to see the RSI breaking above the 50 level to indicate that the bulls have taken control of the market momentum.
Conclusion
The market continues to struggle as investors wonder if price action will continue to make fresh lows for 2019, or worse even if price action breaks below $3,228 and makes lows beneath the 2018 low.
The $3,241 handle continues to be the next crucial level to watch moving forward. If the bulls can defend this level, then the market may make a short-term recovery. However, if the market falls beneath $3,421, we could see further shaky price declines over the following couple of weeks.