
- The CBOE has re-submitted a joint-rule change proposal with VanEck and SolidX.
- JP Morgan analysts predict that BTC will head below $1,260 if the bear market continues.
- Support for BTC moving forward: $3,467, $3,421, $3,400, $3,350, $3,331, $3,284, $3,228.
- Resistance for BTC moving forward: $3,508, $3,569, $3,618, $3,639, $3,664, $3,851, $3,896, $3,942, $4,001.
Latest Bitcoin News
After withdrawing their Bitcoin ETF proposal on January 22, 2019, which was largely due to to government shutdown rendering the SEC as a partial service, the CBOE has re-submitted their joint-rule change proposal with investment firm VanEck and financial services company SolidX.
In other Bitcoin news, JP Morgan has come forward and voiced their skepticism about the future value of cryptocurrency. In an article from Reuters, JP Morgan analysts stated that participation by financial institutions in the cryptocurrency markets has slipped over the last 6 months as individual investors have taken up the increase in market share.
They also stated that they believe that Bitcoin will have a cost support around the $2,400 mark, but price action could fall below $1,260 if the bear market persists.
Let us continue to take a look at price action for BTC/USD and highlight any potential areas of support and resistance moving forward.
BTC Price Analysis
Bitcoin has seen a price decline totaling 1.49% over the past 7 trading days, bringing the current trading price down to around $3,495, at the time of writing. The market has now seen a price fall of 8.77% over the past 30 trading days with a further, more significant 46% price plummet over the past 90 trading days.
Bitcoin currently holds a market cap value of $60.70 billion as the 69-month old project now trades at a value that is 82% lower than the all-time high price.
BTC/USD Price
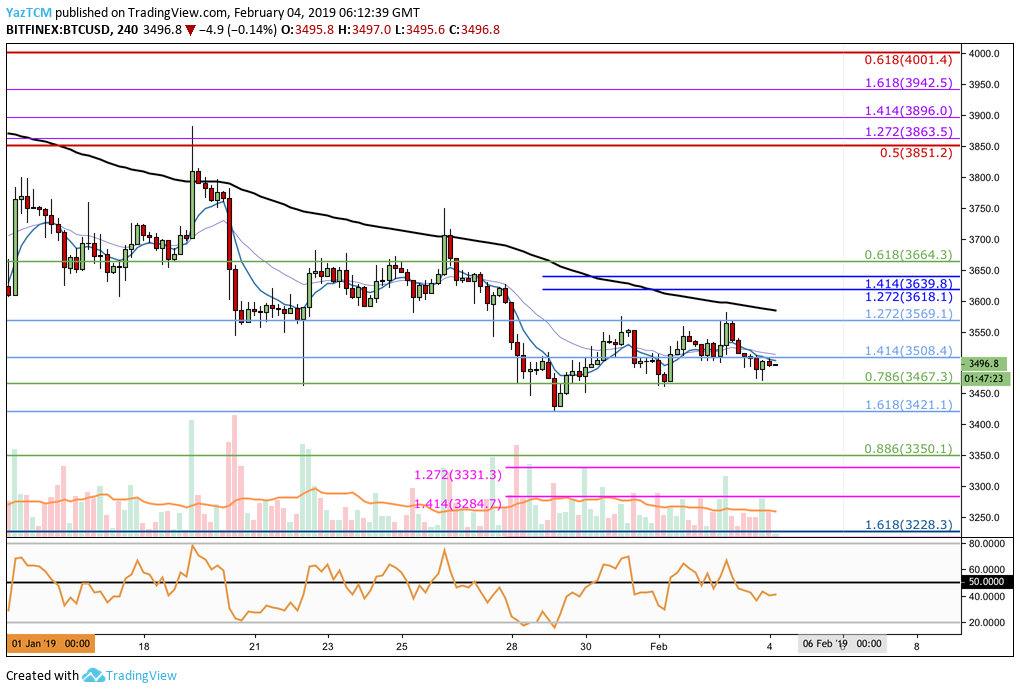
Taking a look at the 4HR BTC/USD chart above, we can see that since our last analysis, price action has continued to trade in a sideways manner over the past few days.
The market met resistance at the medium-term downside 1.272 Fibonacci Extension level (drawn in light blue) priced at $3,569 and reversed. It then went on to find support at the short-term .786 Fibonacci Retracement level (drawn in green) priced at $3,467.
The market has now established a short-term trading range between these two levels as participants wait to see which direction price action will break out towards next.
Trend: Neutral
Although the long-term trend is still bearish, the short-term trend is now neutral as the market has established a trading range between $3,569 and $3,467.
If price action breaks below the trading range, we can consider that the bearish trend will continue. A break above the trading range will signal that the short-term trading trend is turning bullish.
Where is the BTC Market Likely to Head Towards Next?
This all depends on which direction the market breaks towards.
If price action breaks below the support at the short-term .786 Fibonacci Retracement level (drawn in green) priced at $3,467 and heads lower, we can expect immediate further support below at the medium-term downside 1.618 Fibonacci Extension level (drawn in light blue) priced at $3,421.
If the sellers continue to push price action further below $3,421, then more support can be expected at the short-term .886 Fibonacci Retracement level (drawn in green) priced at $3,350. This is followed by further support located at the short-term downside 1.272 and 1.414 Fibonacci Extension levels (drawn in pink) priced at $3,331 and $3,284, respectively.
The final level of support to highlight is located at the previous long-term downside 1.618 Fibonacci Extension level (drawn in blue) priced at $3,228. This support level had caused the 2018 bearish run to reverse, and therefore is expected to provide strong support heading forward.
What if BTC Price Breaks Above the Current Trading Range?
If the bulls manage to push price action for BTC/USD higher and cause the market to break above the resistance at $3,569, we can expect immediate resistance higher at the short-term 1.272 and 1.414 Fibonacci Extension levels (drawn in blue) priced at $3,618 and $3,639, respectively.
This is closely followed by more resistance located at the short-term .618 Fibonacci Retracement level (drawn in green) priced at $3,664.
If the market breaks above $3,664, there is higher resistance at the $3,800 handle, followed by resistance at the bearish .5 Fibonacci Retracement level (drawn red) priced at $,3851. Resistance above this can then be expected at the higher short-term 1.414 and 1.618 Fibonacci Extension levels (drawn in purple) priced at $3,896 and $3,942, respectively.
The final level of resistance to highlight is located at the bearish .618 Fibonacci Retracement level (drawn in red) priced at $4,001.
What are the Technical Indicators Showing?
The RSI on the 4HR chart has recently dropped below the 50 handle which indicates that the momentum is in the hands of the sellers. If the RSI continues to fall lower, we can expect price action to break below the lower boundary of the trading range.
The RSI on the daily chart is also well below the 50 handle, indicating the long-term bearish control within the market.
Conclusion
Bitcoin is in a troublesome position at this moment in time. The year had started off promising but sentiment has turned fearful as speculators wonder if price action will continue to make fresh lows below $3,228.
We will be closely watching the next move for BTC price action to break above or below the trading range before making any fresh trading decision. If the market does break below the range, traders should prepare for further price drops over the coming days.