
Ripple has seen a well-received rebound over the past 24 hours of trading, allowing the price to climb above the $0.42 level once again. Ripple has been remarkably resilient during the recent cryptocurrency price drops falling by a total of only 1% over the past 7 trading days.
Ripple is now on the road to break above the resistance around $0.48 to create a fresh 2019 high after the cryptocurrency surged by a total of 40% over the past 30 days of trading.
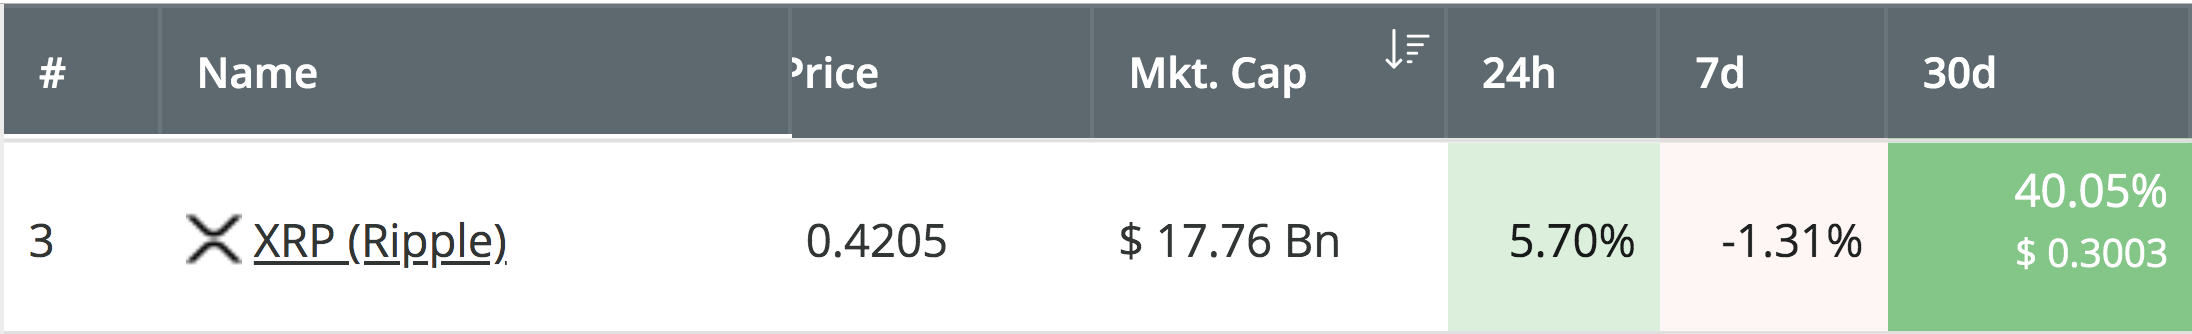
Source: CoinCheckup
The cryptocurrency remains ranked in 3rd position amongst the top cryptocurrencies by market cap, as it currently holds a $17.74 billion market cap value. However, if Ripple manages to break above the resistance at $0.48, the cryptocurrency could surge much higher and eventually claim Ethereum’s 2nd-ranked position.
Let us continue and take a look at the XRP/USD market and highlight some potential areas of resistance moving forward.
Ripple Price Analysis
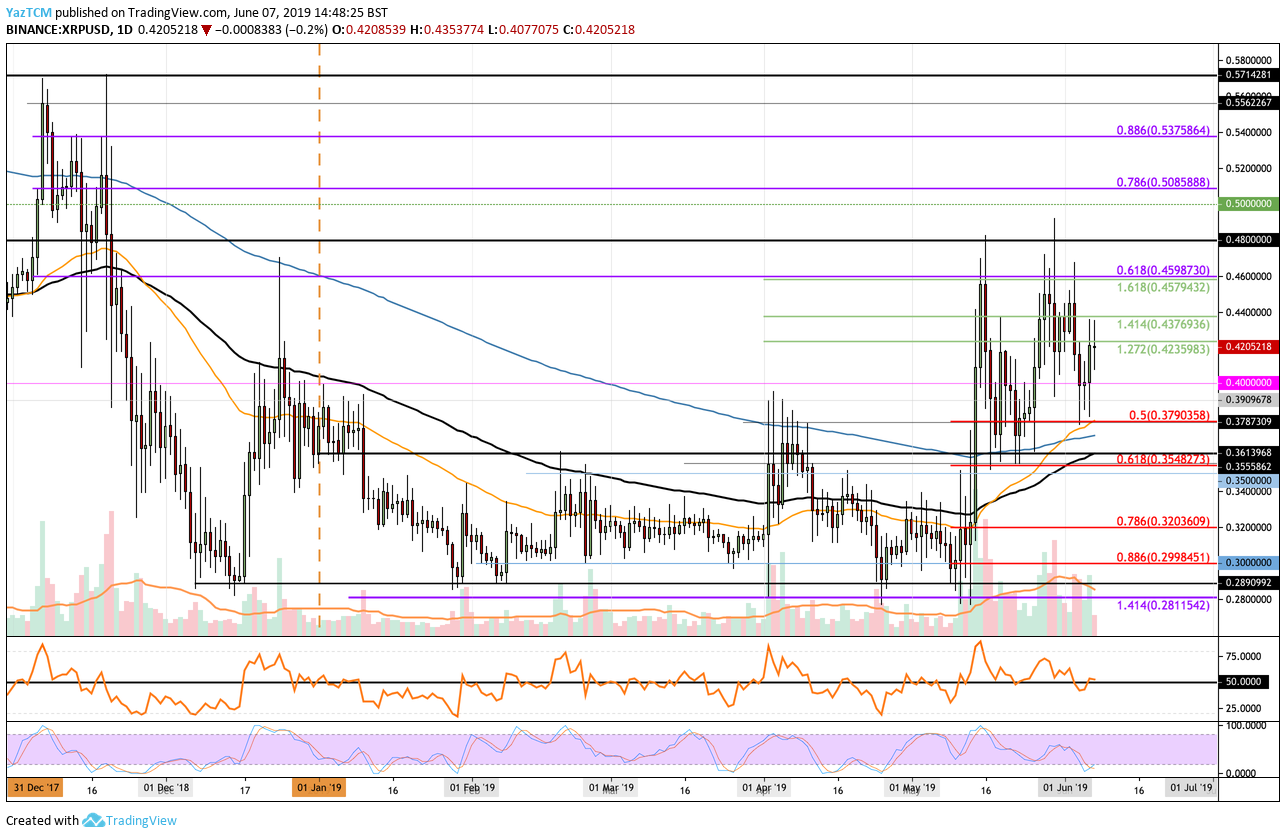
XRP/USD – MEDIUM TERM – DAILY CHART
What Has Been Going On?
We can see that during the recent cryptocurrency turnaround, when Bitcoin dropped from above $9,000 to below $8,000, Ripple dropped into support at the $0.3790 level where the rebound occurred. This level of support was provided by a short-term .5 Fibonacci Retracement level (drawn in red).
After rebounding from this level of support, we can see that Ripple went on to break above the resistance at $0.40 and is now currently attempting to break above the resistance at the previous short-term 1.272 Fibonacci Extension level (drawn in green), priced at $0.4235.
Where Can We Go From Here?
If the buyers are successful in breaking above the $0.4235 resistance, we can expect immediate higher resistance to then be located at the $0.4380 and $0.45 levels. Above this, further higher resistance is then expected at the bearish .618 Fibonacci Retracement level (drawn in purple), priced at $0.46. This is measured from the November 2018 high to the December 2018 low.
Above $0.46, further higher resistance is expected at $0.48 and $0.50. This is then followed up with more resistance at the bearish .786 and .886 Fibonacci Retracement levels (drawn in purple), priced at $0.5085 and $0.5375, respectively.
What Are the Technical Indicators Showing?
The Stochastic RSI is currently trading in oversold conditions, which suggests that the previous round of selling is coming to a close. The crossover above signal has already occurred, which means that we should expect the bullish pressure to mount very soon.