
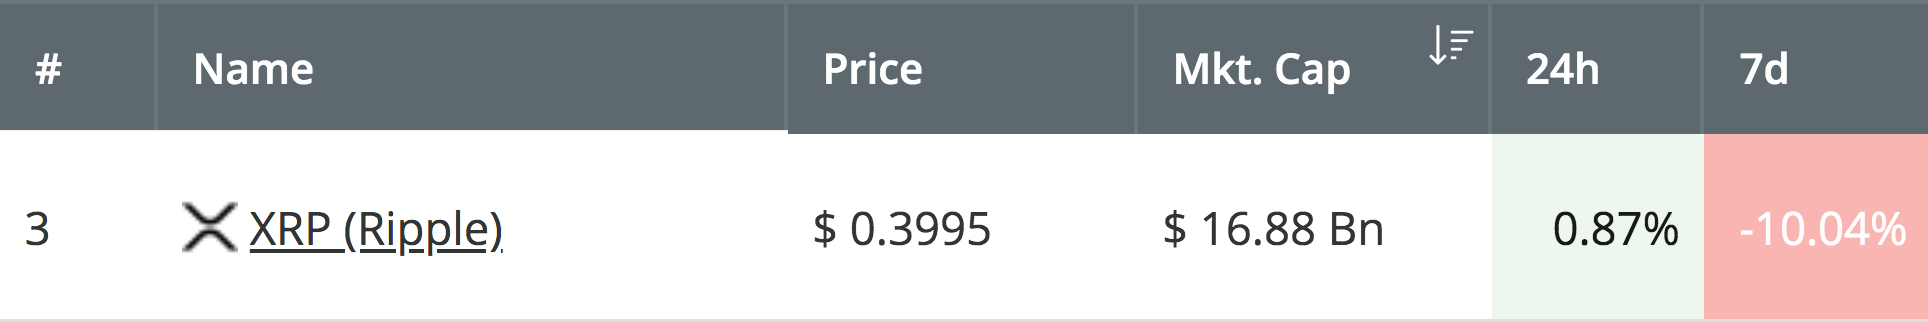
The past 7 trading days have seen Ripple fall by a very steep 10%, bringing the current price for the cryptocurrency down to around $0.3995 at the time of writing. However, despite the recent price declines seen during June 2019, the cryptocurrency has done very well to rebound at an area of support, and is now on track to break out of a short-term acute symmetrical triangle to start the week on a bullish note.
Source: CoinCheckup
Ripple is currently ranked in 3rd position, as it presently holds a $16.88 billion market cap value. However, there is evidence to suggest that Ripple may have a larger market cap than Ethereum, which would put it in 2nd place.
Let us continue to take a look at the XRP/USD market and highlight some potential areas of resistance moving forward.
Ripple Price Analysis
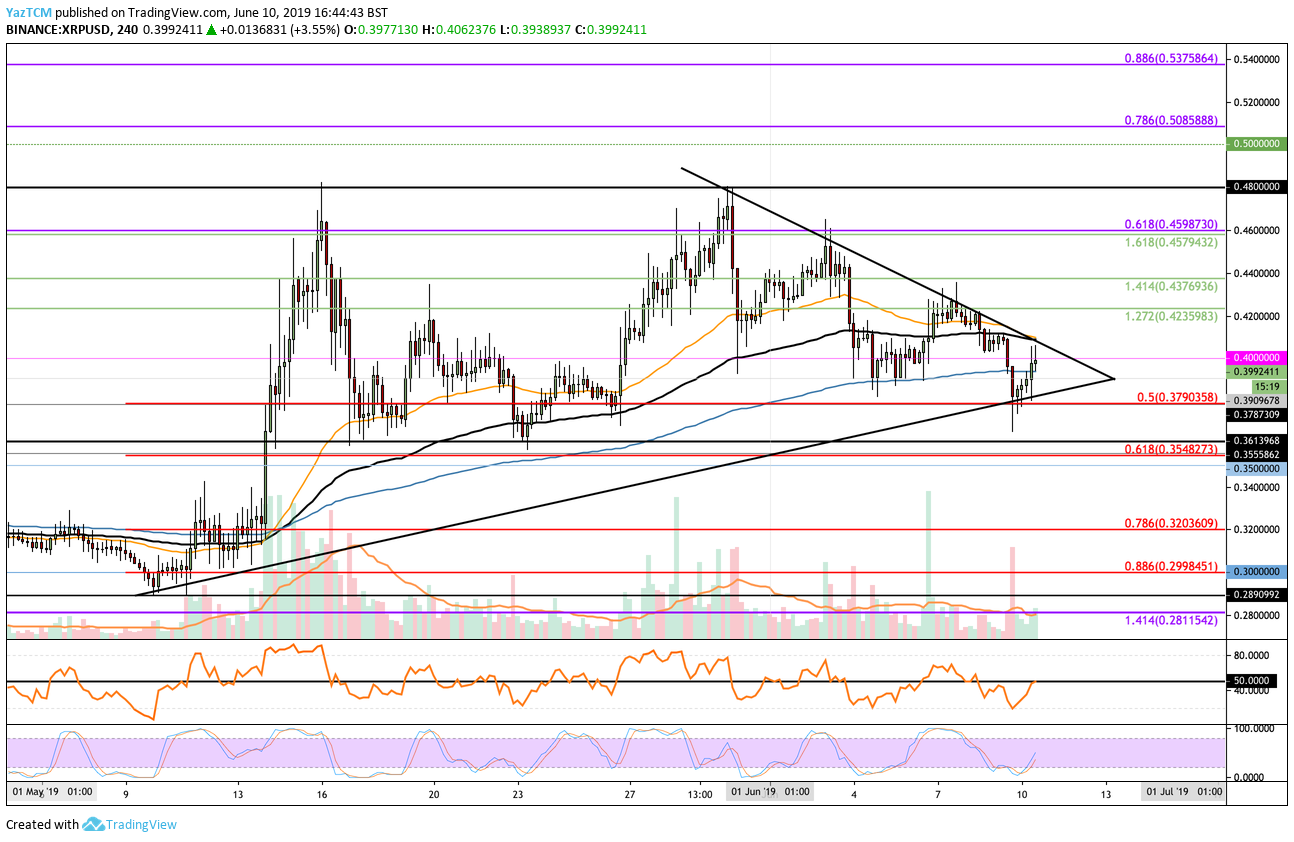
XRP/USD – SHORT TERM – 4HR CHART
What Has Been Going On?
Taking a look at the 4HR chart above, we can see that Ripple met resistance at the $0.48 level toward the end of May 2019. Ripple went on to drop as June started to trade, but had recently found support at the short-term .5 Fibonacci Retracement level (drawn in red) priced at $0.3790. This level of support was further increased by the lower boundary of the short-term symmetrical triangle being located at the exact same price level.
Ripple is now traveling higher, and it looks like it will be making an attempt to break above the triangle pretty soon.
What Is the Current Trend?
The current trend for Ripple is neutral until the cryptocurrency can break above the upper boundary of the symmetrical triangle. For this market to be considered bearish, we will need to see Ripple drop beneath the support at $0.37.
Where Can We Go From Here?
The first level of resistance to tackle is located at the $0.40 level, which is immediately followed up with more resistance at the upper boundary of the symmetrical triangle. Above the triangle, we can expect higher resistance to then be located at $0.4235, $0.4375, and $0.46. The resistance at $0.46 is further bolstered by the long-term bearish .618 Fibonacci Retracement level (drawn in purple).
Above $0.46, further higher resistance then lies at $0.48 and $0.50. If the bulls can break above $0.50, higher resistance is expected at the bearish .786 and .886 Fibonacci Retracement levels (drawn in purple), priced at $0.5085 and $0.5375, respectively.
Alternatively, if the sellers push the market beneath the support at $0.3790, we can expect immediate support below at $0.36 and $0.3550.