
- Waves has seen an incredible price surge totaling over 400% since rebounding from the low in December 2018.
- Support moving forward: $2.56, $2.45, $2.00, $1.85, $1.74, $1.43, $0.99.
- Resistance moving forward: $3.05, $3.55, $4.16, $4.32, $6.27, $6.87.
Waves has seen a sharp decline totaling 8.87% over the previous 24-hour trading session, bringing the current trading price down to around $2.93, at the time of writing.
However, the cryptocurrency has seen some momentous gains over the past 30 trading days as the cryptocurrency surges by over 92%.
The 31-month old project is now ranked in 23rd position as it presently holds a market cap value of $293 million. After seeing a price hike over the previous 90 trading days totaling 37%, the WAVES/USD project is now trading at a price that is 83% lower than the all-time high value.
Let us continue to take a look at the WAVES/USD market over the short term and highlight any potential areas of support and resistance moving forward.
WAVES/USD Price Analysis
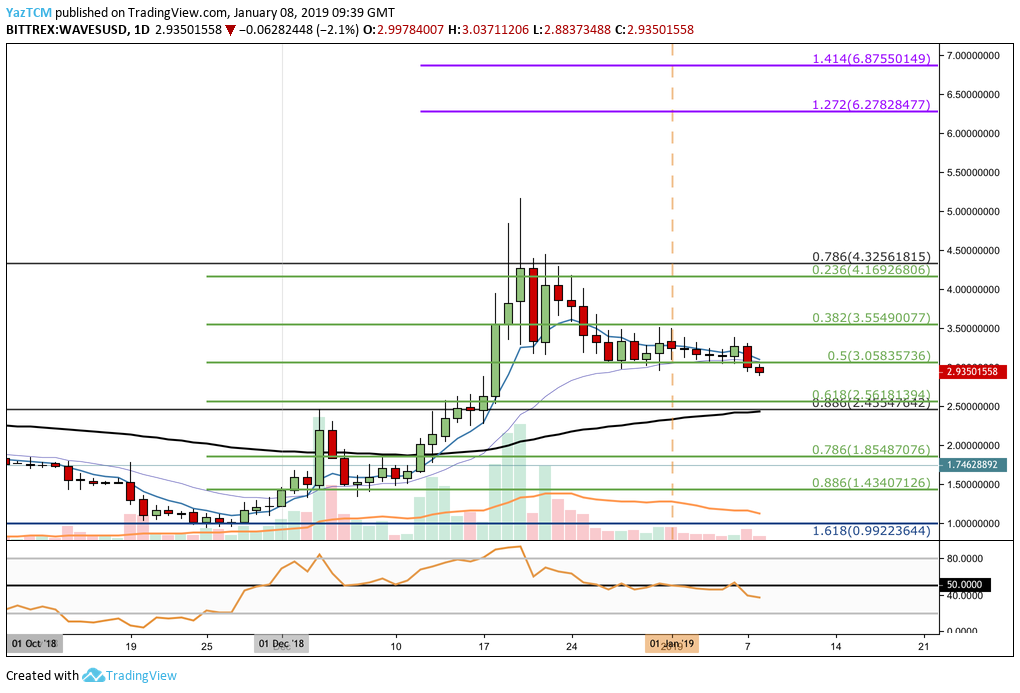
After rebounding from the long-term downside 1.618 Fibonacci Extension level (drawn in blue) priced at $0.99, the WAVES/USD market went on to make some momentous gains throughout the month of December.
In fact, the cryptocurrency surged by a total of 424% to reach a high of $5.15 on December 20, 2018.
We can see that the market had met resistance around the long-term .786 FIbonacci Retracement level (drawn in black) priced at $4.32, dating all the way back to April 2017, and was unable to close above this area of resistance.
Price action has since pulled back slightly and recently dropped below the .5 Fibonacci Retracement level (drawn in green) priced at $3.05.
Trend: Neutral
The recent slip below the $3.00 handle may be signalling a short term downtrend, however it is still too early to call. At this moment in time the market is consolidating through the retracement from the previous swing higher.
For the market to be considered bearish again we would need to see price action break below the $2.50 handle. Alternatively, for the market to be considered bullish we would need to see WAVES/USD break above the resistance at the $4.32 handle.
Where is the Support Located Below the Market?
If the sellers continue to drive price action lower, we can expect immediate support towards the downside to be located at the short-term .618 Fibonacci Retracement level (drawn in green) priced at $2.56, closely followed by the long term .886 Fibonacci Retracement (drawn in black) priced at $2.45.
The support at this area is further bolstered by the 100-day moving average, priced at the $2.45 handle, adding significantly to the expected level of support.
If the sellers continue to drive price action below the support at the $2.00 handle, further support below can then be located at the short-term .786 and .886 Fibonacci Retracement levels (drawn in green), priced at $1.85 and $1.43 respectively.
The final level of support to highlight towards the downside is located at the long-term downside 1.414 Fibonacci Extension level (drawn in blue) priced at $0.99.
Where is the Resistance Located Above the Market?
If the buyers step back into the market and push price action back above initial resistance at the $3.05 handle, we can expect further resistance toward the upside to be located at the short-term .382 and .236 Fibonacci Retracement levels (drawn in green), priced at $3.55 and $4.16 respectively.
If the bulls can continue and penetrate above the resistance at the long-term .786 Fibonacci Retracement level (drawn in black) priced at $4.32, we can expect further resistance above to be located at the medium-term 1.272 and 1.414 Fibonacci Extension levels (drawn in purple), priced at $6.27 and $6.87 respectively.
Let us continue to take a look at price action for WAVES against BTC and highlight any potential areas of support and resistance within the market.
WAVES/BTC Price Analysis
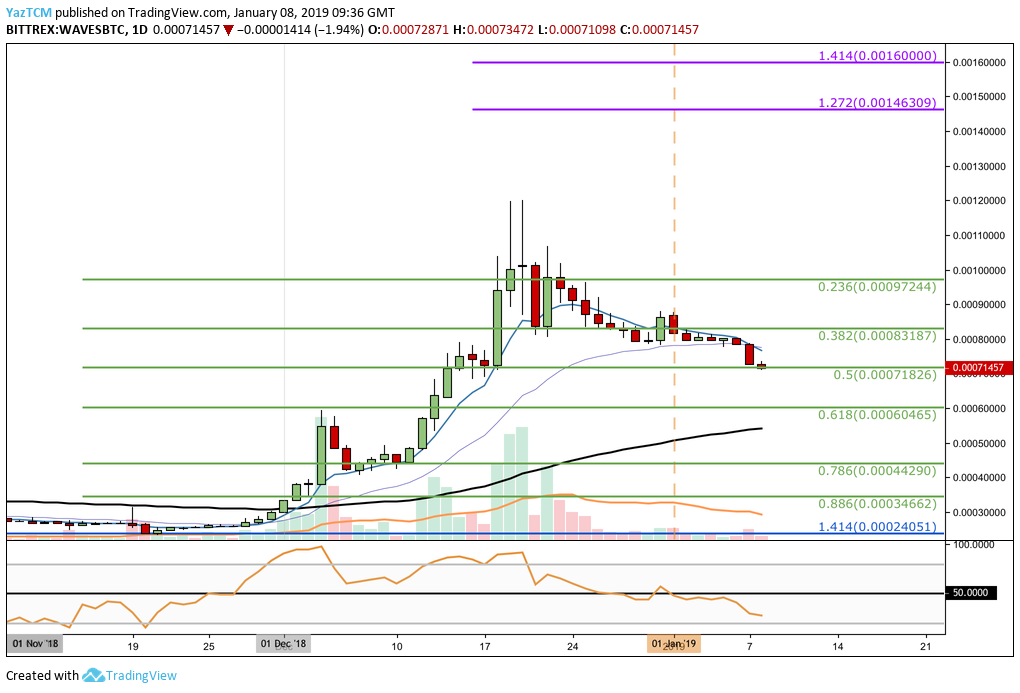
After bouncing from support at the downside 1.414 Fibonacci Extension level (drawn in blue) priced at 24,051 SATS during November 2018, the WAVES/BTC market went on to surge by a total of 398% to reach a high of 119,900 SATS on December 20, 2018.
The market has retraced slightly from this peak and has now reached support at the .5 Fibonacci Retracement level (drawn in green) priced at 71,82 SATS.
Trend: Neutral
Similarly, this market is trading within the retracement from the previous bullish leg.
For WAVES/BTC to be considered bearish, we would need to see the market break below the 60,000 SATS handle. For it to be considered bullish, we would need to see price action break above the 100,000 SATS handle again.
Where is the Support Below 70,000 SATS?
If the bears push price action below the support at 70,000 SATS, we can expect further support toward the downside to be located at the short-term .618 and .786 Fibonacci Retracement levels (drawn in green), priced at 60,465 SATS and 44,290 SATS respectively.
Where is the Resistance Above 80,000 SATS?
If the buyers can re-engage their momentum and push WAVES/BTC above the resistance at 80,000 SATS, they will encounter more resistance above at the short-term .382 and .236 Fibonacci Retracement levels (drawn in green) priced at 83,187 SATS and 97,244 SATS respectively.
Further resistance above the 100,000 SATS handle can then be located at the medium-term 1.272 and 1.414 Fibonacci Extension levels (drawn in purple), priced at 146,309 SATS and 160,000 SATS respectively.
Conclusion
The WAVES market has seen an incredible bullish wave over the past month which is so extreme that it is expected that there will be some pull-backs of some form.
It is important to remain patient and wait for the market to complete its retracement before re-entering into any trades. The $2.50 handle will be the next important level for the bulls to defend to prevent price action from slipping further lower.