
Tron has seen a significant 16% price increase over the past 24 hours of trading allowing the cryptocurrency to climb toward the $0.36 level. The cryptocurrency has now seen a 23% price increase over the past 7 trading days with a further 46% price increase over the past 30 trading days.

Source: CoinCheckup
In this article, we will take a look at the resistance for Tron on the way up toward the $0.04 level. For Tron to rise and reach the $0.04 target, the cryptocurrency will need to increase by a total of 13% from the current price. The last time that Tron was at the $0.04 level was way back during July 2018 and therefore to reach $0.04, Tron will also be placing multi-month long fresh highs.
Tron is presently ranked in the 11th position amongst the top cryptocurrency projects by market cap valuation. The cryptocurrency currently holds a $2.31 billion market value and it sits a small $40 million behind the 10th position holder, Cardano.
Let us continue to take a look at the Tron market against the US Dollar and highlight some areas of potential support and resistance moving forward.
Tron Price Analysis
TRX/USD – MEDIUM TERM – DAILY CHART
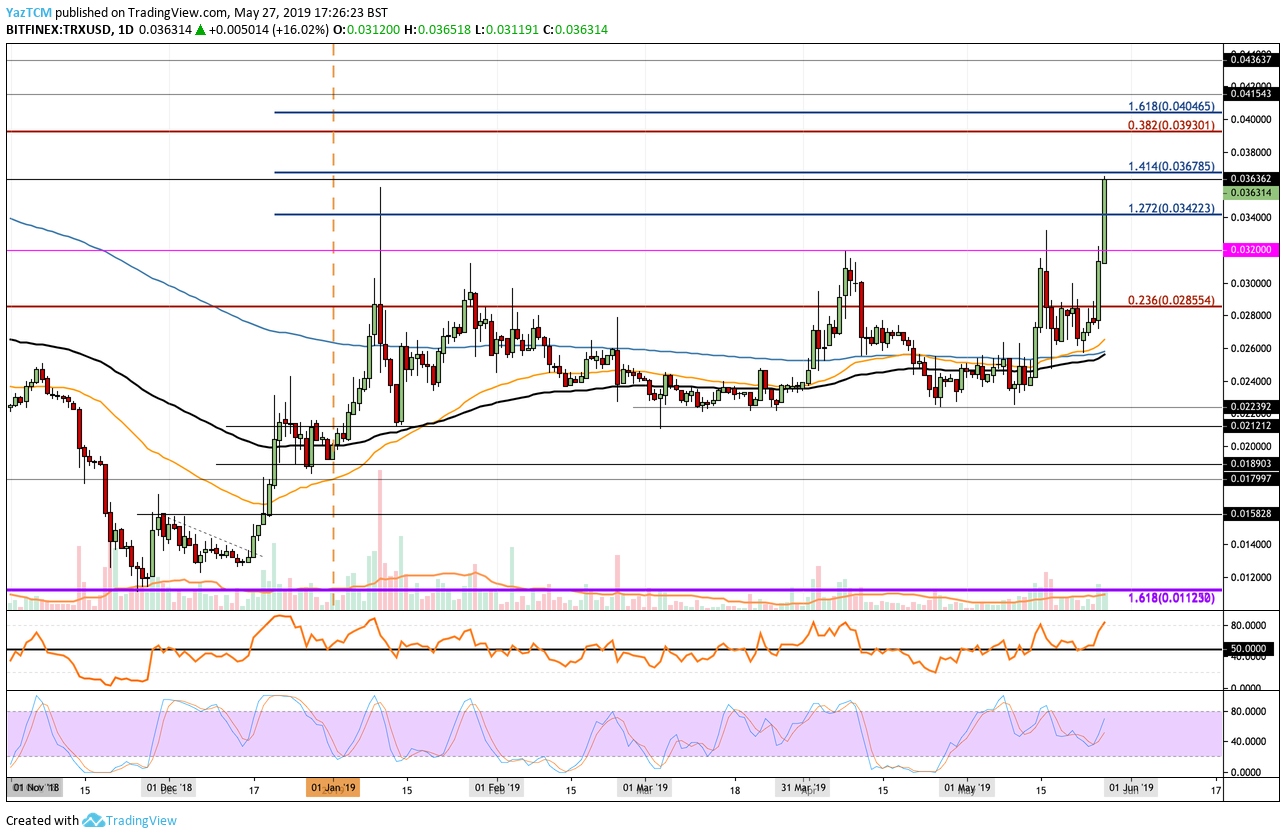
What Has Been Going On?
Analyzing the daily chart for TRX/USD above, we can see that Tron has recently surged into resistance at the $0.03632 level where the price increase stalled. The recent price increase has now allowed Tron to set a fresh 2019 high at the $0.036515 level.
Previous to the recent price surge, we can see that Tron was largely trading sideways throughout the first half of May 2019 as price action traded along the 200-day moving average level.
What Is The Current Trend?
The current trend for Tron remains bullish in the short and long term. For this bullish trend to be canceled, we would need to see Tron fall and break beneath the $0.026 level.
Where Is The Resistance Toward $0.04?
If the bullish pressure continues to push Tron above the current resistance at the $0.03632 level, we can expect immediate higher resistance above the market to be located at the medium termed 1.414 Fibonacci Extension level (drawn in blue) priced at $0.03678. Above this, further higher resistance is then to be expected at $0.038 and then at the long term bearish .382 Fibonacci Retracement level (drawn in red) priced at $0.3930. This bearish Fibonacci Retracement level is measured from the May 2018 high to the December 2018 low.
If the buyers can clear the resistance at the $0.3930 level, they will be clear to make an attempt at the $0.04 price target level. The resistance at $0.040 is considered strong due to the medium term 1.618 Fibonacci Extension level (drawn in blue) priced at $0.04046.
Above $0.04046, further higher resistance is then expected at the $0.04154, $0.042, and $0.04363.
What If The Sellers Regain Control?
Alternatively, if the sellers regroup and begin to push the market lower, we can expect immediate support beneath the market to be located at the previous medium-term 1.272 Fibonacci Extension level (drawn in blue) priced at $0.03422. Support beneath this is located at $0.032, $0.031 and $0.030.
Beneath $0.03, further support then lies at $0.029, $0.02855, $0.028, and $0.027.
What Are The Technical Indicators Showing?
The RSI has recently rebounded and climbed further higher from the 50 level which indicates that the bulls have managed to remain in control of the market momentum during the majority of May 2019.
Conclusion
The recent price surge in Tron has been very well received by Tron holders. If the overall cryptocurrency surge can continue, we may see Tron entering the top 10 cryptocurrencies fairly soon and reach the target level at $0.040.