
- Stellar continues to create fresh lows within the XLM/USD markets.
- The cryptocurrency is still experiencing strong adoption despite the bearish year.
- Support moving forward: $0.1338, $0.13, $0.1250, $0.1206, $0.1116.
- Resistance moving forward: $0.14, $0.1447, $0.15, $0.16, $0.1648, $0.1752, $0.1885, $0.20.
Latest Stellar News
After conducting the largest airdrop in cryptocurrency history consisting of over $100 million, Stellar continues to increase its accessibility and adoption rate with its listing on the NDAX (National Digital Asset Exchange).
NDAX, an exchange based in Canada, has recently announced the addition of XLM to their services. This inclusion of XLM has now opened doors to create the first ever XLM/CAD pairing, providing an avenue for Canadian citizens to invest in Stellar directly in their home currency.
NDAX seems to be a relatively new exchange and has promised zero trading fees until the end of January 2018 for the XLM/CAD pairing. They also are able to boast about their fast order execution times with professional charting tools, providing a reliable service for investors within the region.
To add to the great news for Stellar, the network has recently undergone a great increase in new accounts. The number of Stellar accounts had increased from around 170,000 at the start of the year to over 2 million accounts at the latest calculation, despite the turbulent year-long bear market for the entire industry.
These recent developments seem promising for Stellar holders as adoption continues to grow for the cryptocurrency.
Stellar (XLM) Price Analysis
Stellar has undergone a further price decline totaling over 6.42% over the past 24-hour trading period, bringing the total 7-day price drop to around 15%. The market is now trading at a price of $0.1364, at the time of writing, as price action dips below the $0.14 support handle overnight.
Stellar is now ranked in 4th position and presently holds a total market cap value of $2.63 billion. The cryptocurrency has seen an extremely worrying 30-day period where price action had dropped by over 45%.
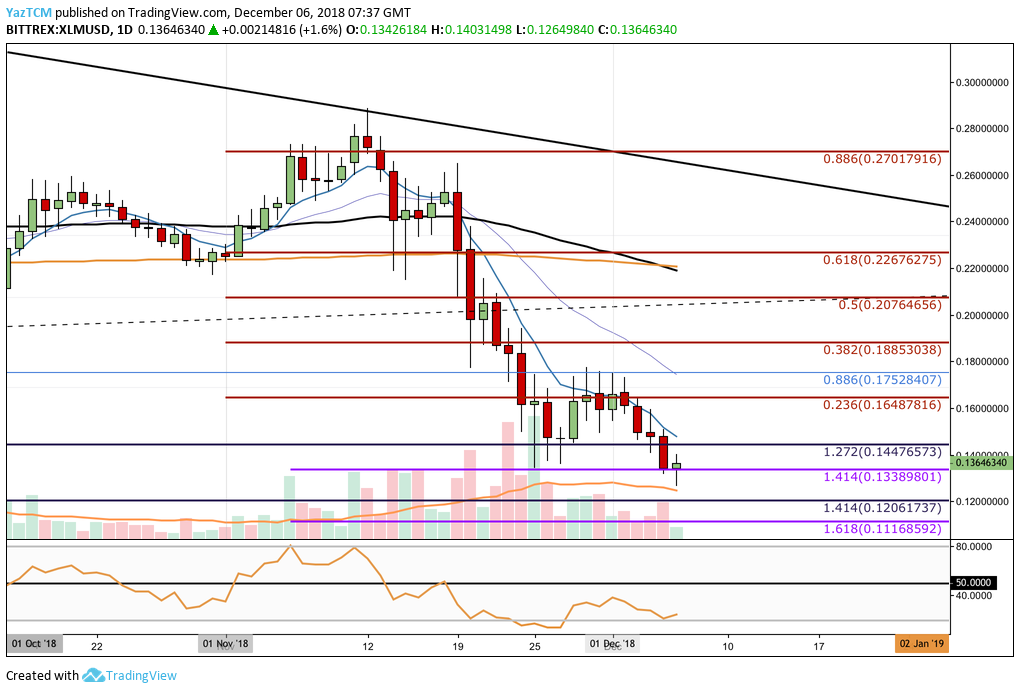
Analyzing price action from the chart above, we can clearly observe the dark few weeks for XLM holders. XLM price has dropped a significant 55% from the November 2018 high of $0.2885 placed on November 12, 2018.
XLM/USD had found a form of support at a downside 1.272 Fibonacci Extension level (drawn in dark blue) priced at $0.1447 toward the end of November 2018.
However, as December opened up trading, the XLM/USD market continued to travel lower to where it is currently trading at support provided by the short-term downside 1.414 Fibonacci Extension level (drawn in purple) priced at $0.1338.
Trend: Bearish — Until a Break Above $0.18
The market is undoubtedly in a bearish trend as price action continues to make lower lows and lower highs as time progresses — the definition of a bear trend. The trend is also not showing any signs of slowing down, which indicates there is room for price to head lower.
How Much Lower Can We Go?
If the selling pressure continues within the market and pushes XLM/USD below the support at $0.1338, we can expect price action to head into lower support at the medium-term downside 1.414 Fibonacci Extension level (drawn in dark blue) priced at $0.1206.
If the bears manage to continue to break below the $0.12 handle, then more support below this can be expected at the short-term downside 1.618 Fibonacci Extension level (drawn in purple) priced at $0.1116.
What If the Bulls Can Regain Control of the Market?
If the bulls can regroup their efforts and push price action higher from $0.1338, we can expect immediate resistance above to be located at the $0.14 round number handle, closely followed by the previous downside 1.272 Fibonacci Extension level (drawn in dark blue) priced at $0.1447.
If the buyers can continue to progress further higher above $0.15 and $0.16, we can expect higher resistance to then be located at the bearish .236 Fibonacci Retracement level (drawn in red) priced at $0.1648, followed by the long-term .886 Fibonacci Retracement level (drawn in blue) priced at $0.1752.
What Are the Technical Indicators Showing?
The technical indicators within the market are currently all favoring the bears at this moment in time.
The RSI is trading well below the 50 handle to indicate that the bears are in control of the market momentum. However, the RSI has recently turned itself upward which could be the first sign that the sellers maybe beginning to lose some of the market momentum.
If the RSI can continue to rise, we can expect the XLM/USD market to continue to make a recovery.
Conclusion
Stellar is not the only cryptocurrency that has seen precipitous losses during November 2018. In fact, the majority of the cryptocurrency market posted over 40% losses during the month, from high to low.
However, Stellar still is not showing any signs of recovery in the short term. The support at $13.38 is important but the support at $0.12 will be critical for the bulls to defend.