
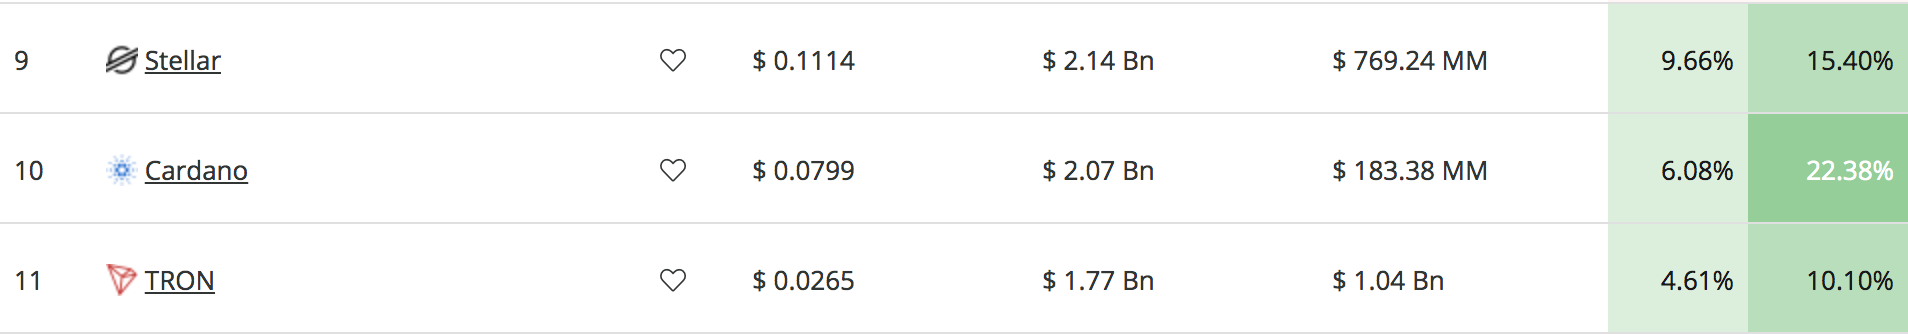
The recent Bitcoin price jump has benefited the majority of the cryptocurrency industry, including coins such as Stellar, Cardano, and Tron. The aforementioned coins are in 9th, 10th and 11th position respectively, and all have seen decent levels of price growth.
Cardano is leading the way with a 22% price increase over the past 7 trading days, with Stellar (15.40%) in the second position and Tron (10%) in 3rd.
Each of these coins is in interesting positions as they have all experienced a drop from their respective highs in April. However, each of these coins has also found a decent level of support to bounce at which could help them travel further higher after reversing.
Let us take a look at the markets for each of these coins and see where they could potentially head toward next.
Stellar Price Analysis
What Has Been Going On?
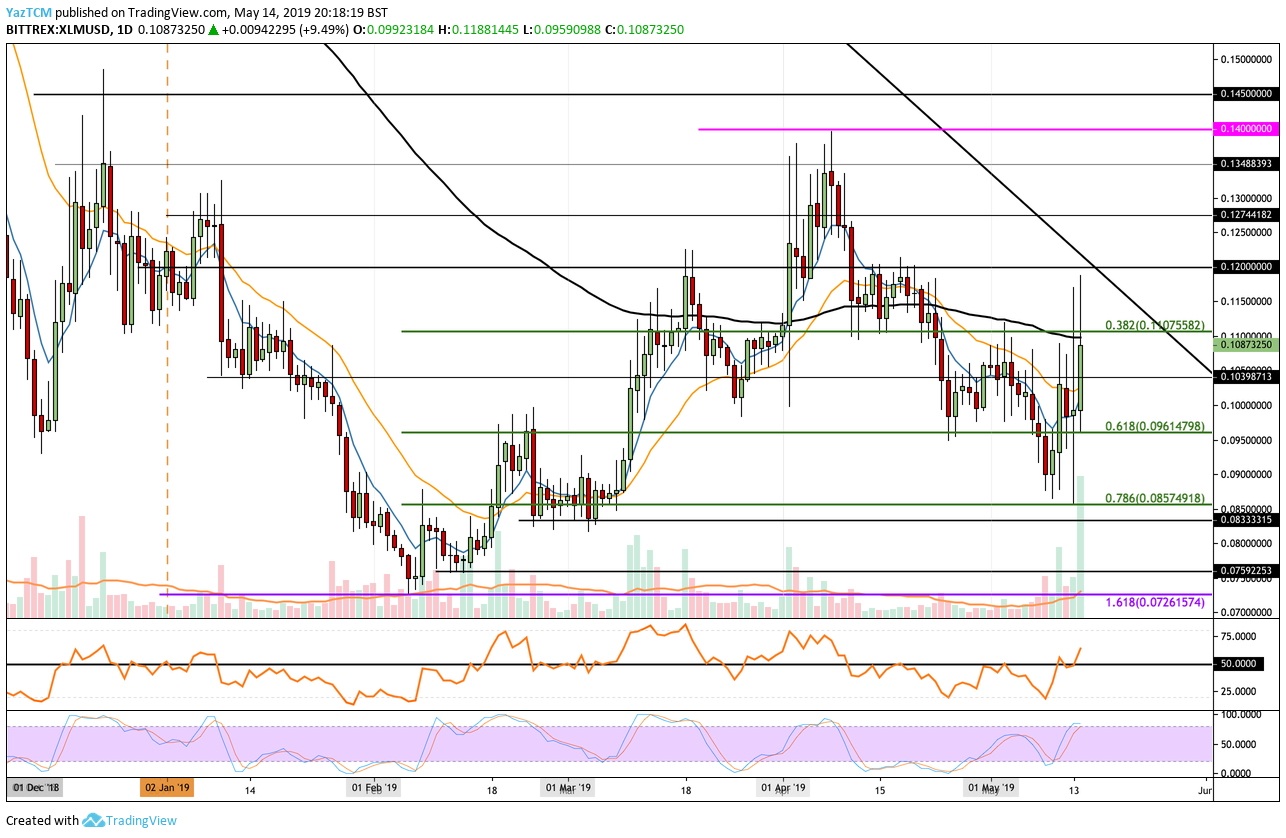
Taking a look at the Stellar chart above, we can see that the market had rebounded from its low in February 2019 at $0.0726 and started to climb higher. Stellar then went on to break above $0.10 during March 2019 and went on to reach a high of $0.14 in April 2019.
After reaching this high, the market rolled over and began to fall, dropping back beneath the 100-day moving average level. We can see that XLM/USD went on to fall during May 2019 until reaching support at the short-term .786 Fibonacci Retracement level (drawn in green), priced at $0.0857. This Fibonacci Retracement level is measured from the low seen in February 2019 to the high seen during April 2019.
XLM/USD has now rebounded at this level and is now currently attempting to break above resistance at the 100-day moving average level priced around $0.11.
Can Stellar Hit $0.14?
For Stellar to reach $0.14, the market will need to increase by a total of 26% from today’s price.
If the bulls are successful in breaking above the resistance at the 100-day moving average, we can expect immediate resistance above to be located at the $0.115 and $0.12 levels. Above $0.12, further resistance is located at $0.13 and $0.1348. If they can clear the resistance here, they will be free to make an attempt at the $0.14 level.
Stellar does not have too much resistance ahead to increase by 26% and hit $0.14 by the end of the month. Furthermore, the RSI has also recently broken above the 50 level, which indicates the bulls have regained possession of the market momentum.
Cardano Price Analysis
What Has Been Going On?
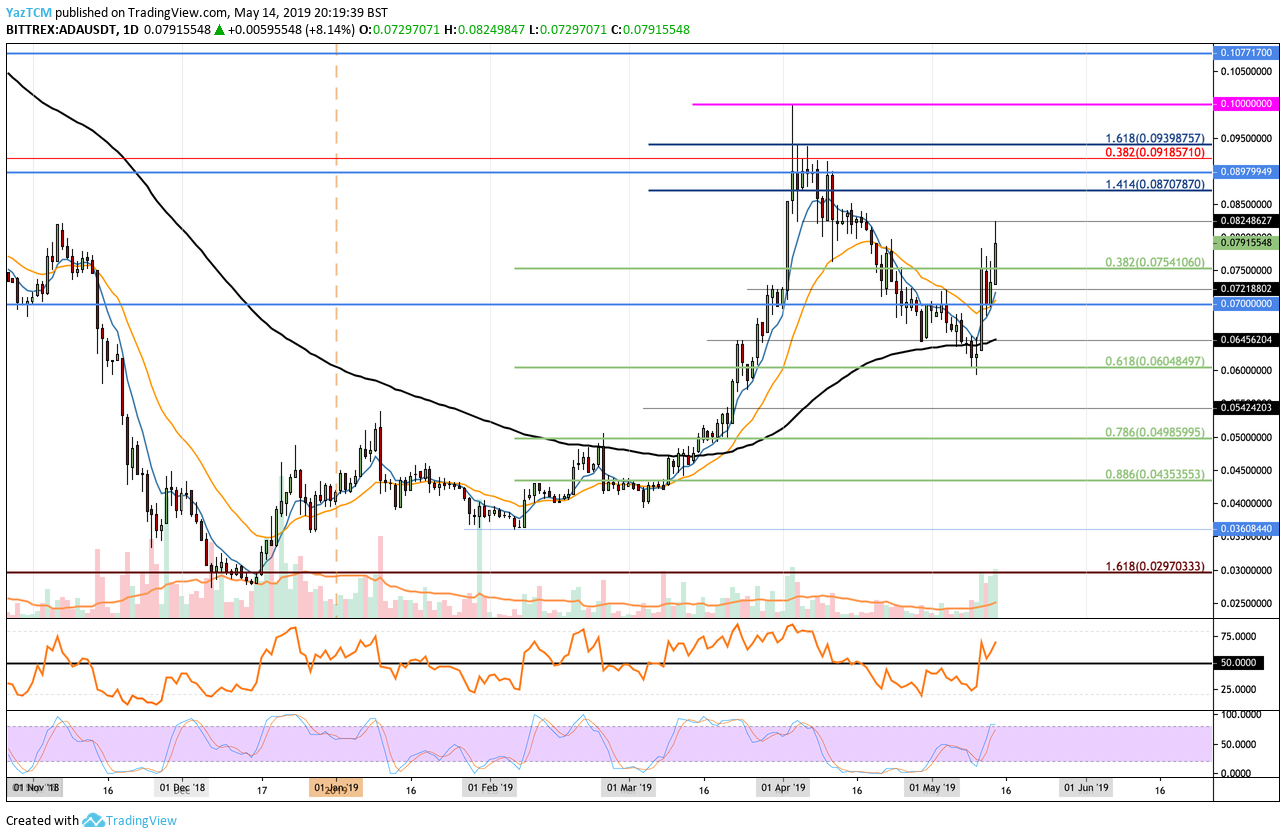
Taking a look at the ADA/USD chart above, we can see that Cardano also saw incredible growth after breaking above the 100-day moving average level in March 2019. After breaking above, the market went on to surge by a total of 150% to reach a high of $0.1 during early April 2019.
Since reaching the aforementioned high, the market has reversed and begun to fall. However, we can see that Cardano has found a level of strong support at the 100-day moving average which has allowed the market to rebound.
Can the Market Hit $0.1 Again?
For Cardano to hit the $0.1 price level again, it will need to increase by a total of 27% from today’s price, which is entirely reasonable.
If the bulls can continue to climb higher and push ADA/USD above the resistance at $0.08, we can expect immediate higher resistance above to be located at $0.082. Further resistance above this is then located at $0.085, $0.087, $0.089, and $0.090.
If the bullish pressure can continue to climb above the $0.090 level, further resistance above is then located at the long-term bearish .382 Fibonacci Retracement level (drawn in red), priced at $0.09185. This long-term bearish Fibonacci Retracement is measured from the July 2018 high to the December 2018 low.
Above $0.09185, more resistance is located at $0.09398, $0.095, and then at the target level of $0.10
The RSI has recently risen above the 50 level, which is also a promising sign for the bulls to continue further higher.
Tron Price Analysis
What Has Been Going On?
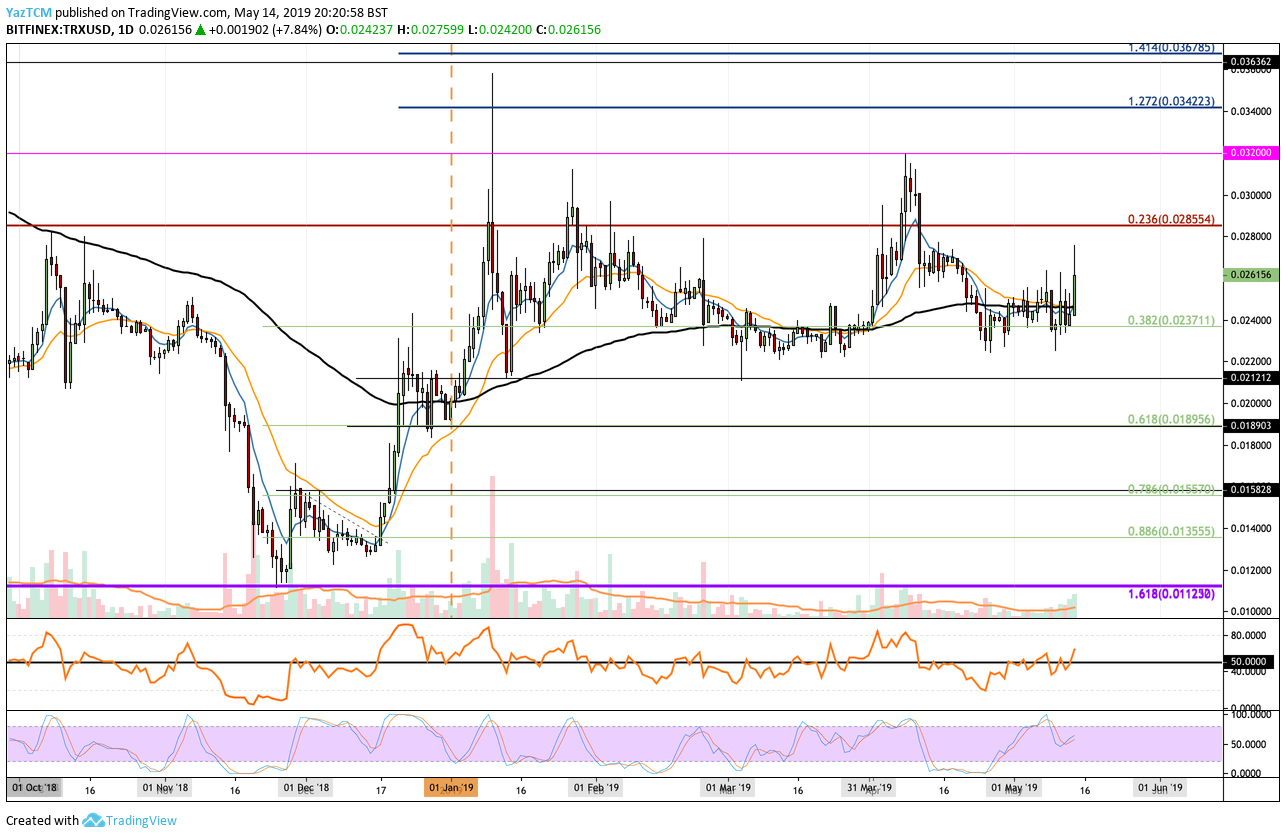
Tron has seen relative sideways price action over the past 3 months, as the market was trapped within the $0.02-$0.032 price range. TRX/USD has largely been trading along the 100-day moving average level, unable to break much further above or below.
Can Tron Hit $0.032?
For Tron to hit $0.032 from today’s prices, it will need to increase by a total of 23%.
If the buyers can continue to cause TRX/USD to climb higher above $0.027, we can expect immediate higher resistance above for TRX/USD to be located at $0.02855, which is resistance provided by a .236 Fibonacci Retracement level (drawn in red). Further resistance above is then expected at $0.029 and $0.030.
If the bullish pressure continues to drive TRX/USD above $0.030, we can expect further resistance above to be located at $0.031 and then at the $0.032 target level.