Ripple has seen a couple of days of whipsawing price action yesterday after dropping below the $0.30 level and then reversing and shooting toward a high of $0.39. The market has now fallen slightly to where it is currently trading at the $0.3257 level.
The recent price increase has now caused Ripple to climb back into the previous ascending price channel and also break above the 100 day moving average for the first time since November 2018.
Ripple has now seen a 13% increase in price over the past 7 trading days as the 68 month old project remains ranked in 3rd position with a $2.34 billion market cap valuation.
Let us take a look at the XRP/USD market and highlight some areas of resistance for the bulls before being able to reach the $0.40 level.
Ripple Price Analysis
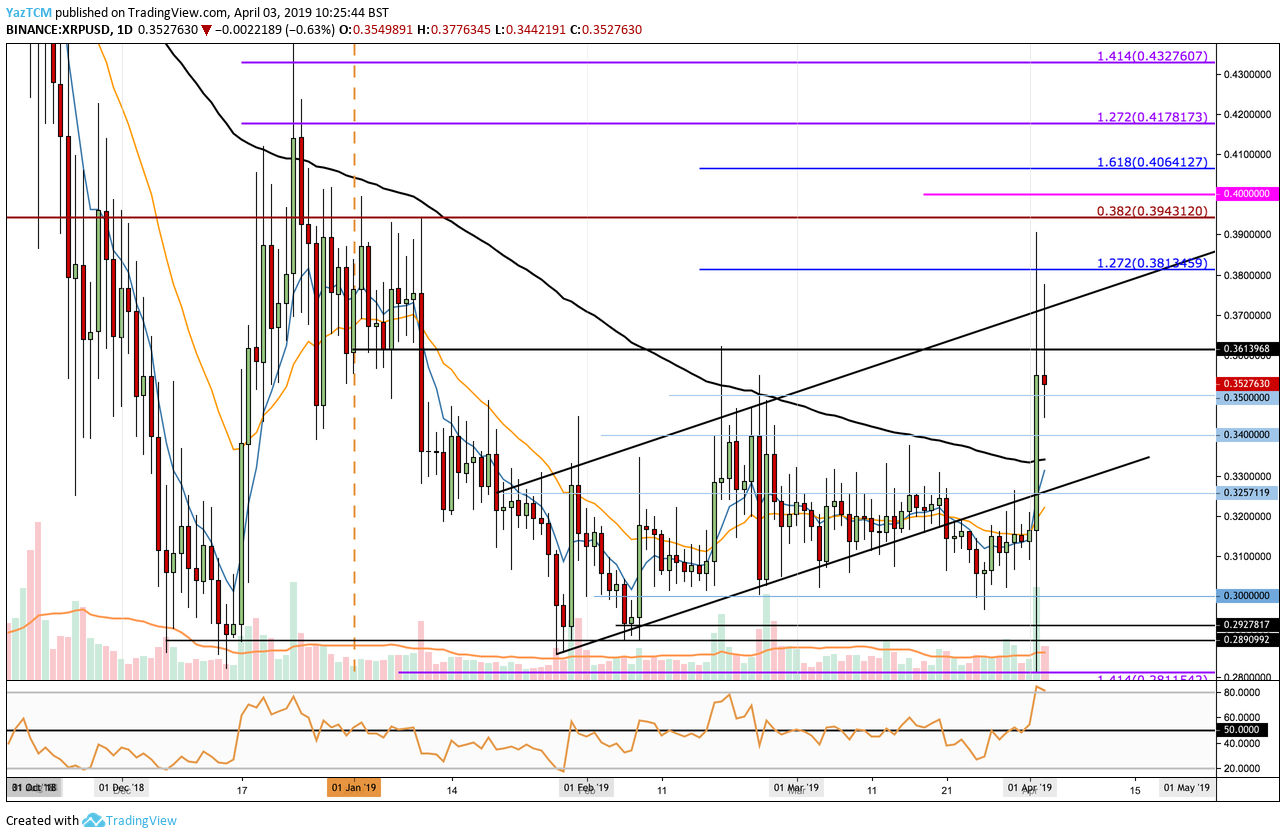
XRP/USD – SHORT TERM – DAILY CHART
What Has Been Going On?
Taking a look at the XRP/USD chart above we can see that during March 2019 the market was trading in a range between the $0.33 level and $0.30. The market had struggled to break above the strong resistance at $0.33 throughout the entire month.
During the Bitcoin price surge in yesterday’s trading session the XRP/USD market had dropped to a low around $0.28 before whipsawing and climbing to a high of $0.029. After reaching resistance at the upper boundary of the ascending price channel the market then reversed and fell into support at $0.035.
Price action had made an attempt to climb higher once again today but the market failed to hold above the price channel and has returned to the opening price for the day.
What Is The Short Term Trend For XRP/USD?
After the market managed to break above the March 2019 $0.33 resistance level the short term trend for XRP/USD is now bullish.
Where Is The Resistance On The Way Up To $0.40?
If the bullish momentum continues to cause XRP/USD to rise, initial resistance above is located at the $0.36 and $0.37 levels. Above $0.37 we can expect more resistance at the upper boundary of the ascending price channel.
Above the ascending price channel, resistance is then located at the short term 1.272 Fibonacci Extension level (drawn in blue) priced at $0.3813. This is then followed up with more resistance at the bearish .382 Fibonacci Retracement level (drawn in red) priced at $0.3943. This bearish Fibonacci Retracement is measured from the November 2018 high to the December 2018 low.
IF the buyers can tackle the resistance at $0.3943 they will be free to make an attempt at $0.40. Above $0.40, we can expect resistance at the medium termed 1.272 and 1.414 FIbonacci Extension levels (drawn in purple) priced at $0.4178 and $0.4327.
What If The Sellers Regain Control?
Alternatively, if the sellers regroup and begin to push XRP/USD lower, we can expect immediate support at the $0.35 and $0.34 levels. This is then followed with support at the 100 day moving average (around $0.335) and the lower boundary of the ascending price channel.
What Are The Technical Indicators Showing?
The RSI has risen into overbought conditions which indicates the market may be a little overstretched. However, so long as the RSI can remain above 50 during the pullback we can expect XRP/USD to continue to head further higher.
Conclusion
Ripple looks like it is well on the way to $0.40. The recent break above the $0.33 level has invalidated March’s sideways movement has provided a platform for XRP/USD to continue to climb toward the $0.40 level. However, the bulls will need significant momentum and volume to break above the ascending price channel before they are able to achieve this.