
- QTUM has recently released their end-of-year report.
- The market is trading within a range between $2.12 and $2.52.
- Support moving forward: $2.12, $2.00, $1.83, $1.54, $1.47.
- Resistance moving forward: $2.32, $2.52, $2.77, $2.92, $3.27, $3.65, $3.75, $3.89, $4.24.
Latest QTUM News
QTUM has recently released its end-of-year report which highlights some of the immense progress that the team has made last year.
Firstly, after releasing 11 official versions of the Qtum Core client in 2018, the client has seen some major performance improvements, which helps the blockchain sync much faster, along with security improvements and some UI and usability improvements.
The QTUM X86 Virtual Machine has also received upgrades in 2018, and it now has multi-language support in C and C++. The new instruction set within the VM helps to support a larger memory space with a higher efficiency of code.
Moving on to Unita, the enterprise version of QTUM, the team has managed to successfully deploy the beta version of the one-click blockchain creation, which allows enterprise users to create customized blockchains quickly and efficiently at the touch of a button.
Unita also can support data on the blockchain, providing secure, decentralized storage on the blockchain.
The mainnet for QTUM has successfully seen over 1.5 million independent QTUM addresses. They have over 4,800 nodes worldwide while the network had seen a peak 24-hour transaction volume of 18,612 transactions.
The report also includes the plethora of partnerships that they have successfully achieved. The most fascinating one is with Amazon Web Services, and they also have partnerships with many universities including the University of Columbia and the University of California Berkeley.
The report ends with the financials of the QTUM team which show that they have spent over 714 BTC on recurrent expenditure, from January to November 2018, which includes technical research and development, PR and operation expenses.
They have also spent over 161 BTC on non-recurrent expenditure which covers business development and compliance costs.
Let us continue to take a look at the QTUM/USD market and highlight any potential areas of support and resistance moving forward.
QTUM Price Analysis
QTUM has seen a small price decline totaling 3.64% over the previous 24-hour trading session, bringing the current trading price down to $2.28, at the time of writing.
The market has now seen a small price hike totaling 3.3% over the past 7 trading days, with a further price surge totaling 43% over the previous trading month.
QTUM is now ranked in 29th position as it presently retains a $200 million market cap value. However, the 19-month old project has lost a significant 97% since placing its all-time high price, so it has a long way to recover still.
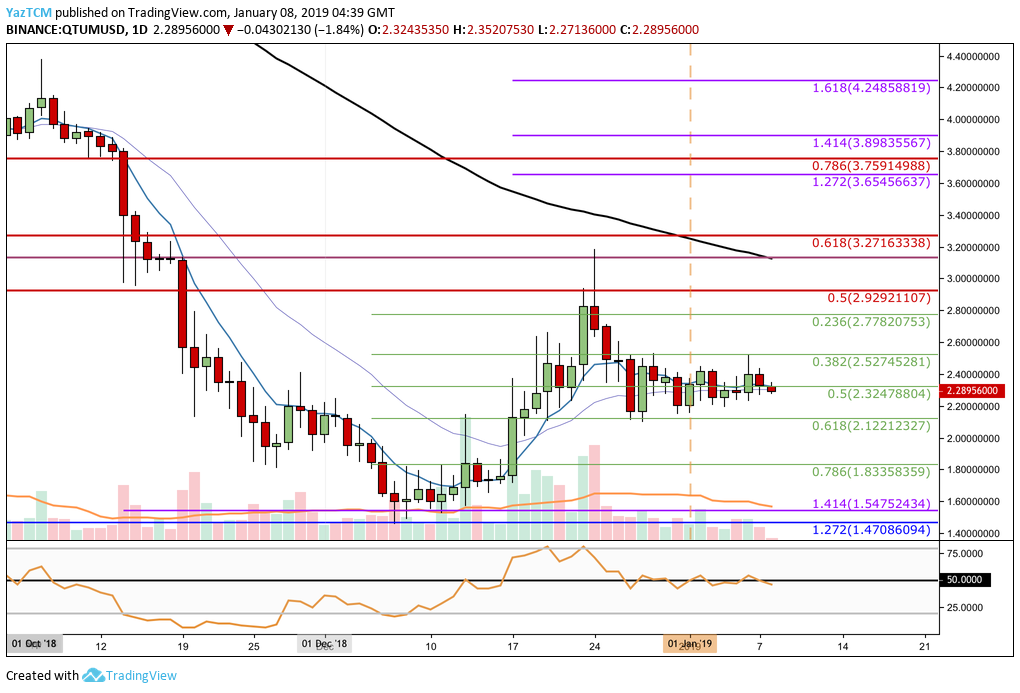
Analyzing price action from the daily chart above, we can see that QTUM/USD had felt the effects of the market-wide bloodbath during November 2018. Price action fell from a high above $4.20 and continued to plummet until it reached support at a long-term downside 1.272 Fibonacci Extension level (drawn in blue), priced at $1.47 in December 2018.
After reaching this level of support, the market had rebounded and began to rally during the later half of December 2018 until it met resistance around the bearish .5 FIbonacci Retracement level (drawn in red) priced at $2.92. This Fibonacci Retracement is measured from the high seen in November to the low witnessed in December 2018.
Price action for QTUM/USD then went on to fall slightly but found support at the short-term .618 Fibonacci Retracement level (drawn in green), priced at $2.12. The market has now been trapped within a trading range between $2.12 and $2.52 ever since.
Trend: Neutral
As mentioned above, the market is now trading within a range between $2.52 and $2.12, rendering the trading condition as neutral.
For the market to be considered bullish, we would need to see price action break above the $3.00 handle. For the market to be considered bearish, we would need to see a break below the lower boundary of the trading range.
Where is the Support for QTUM Below the Range?
If the sellers manage to push price action below the lower boundary of the trading range and breaks below $2.00, we can expect further support beneath to be located at the short-term .786 Fibonacci Retracement level (drawn in green), priced at $1.83.
Further support below $1.83 can be expected at the medium-term downside 1.414 Fibonacci Extension level (drawn in purple) priced at $1.54. This is followed by the long-term downside 1.272 Fibonacci Extension level (drawn in blue) priced at $1.47.
Where Will the Market Meet Resistance Towards the Upside?
If the bulls begin to rally once again, they will first encounter immediate resistance at the .5 FIbonacci Retracement level (drawn in green) priced at $2.32, followed closely by the upper boundary of the trading range priced at $2.52.
If the buyers can then continue to push price action above the trading range, further resistance can then be expected at the bearish .5 and .618 Fibonacci Retracement levels (drawn in red), priced at $2.92 and $3.27.
Further higher resistance will then be expected at the short-term 1.272 and 1.414 Fibonacci Extension levels (drawn in purple), priced at $3.65 and $3.89 respectively.
Conclusion
The progress that QTUM has made during 2018 is remarkable. From development improvements regarding the technology to the partnerships formed with high profile companies, the team continues to prove that they have what it takes to bring blockchain technology closer towards enterprise use.