- ZRX has been one of the best performing coins out of the Top 25 ranked by market cap over the past 30 trading days.
- The market is now resting at combined support at the $0.77 handle.
- Support moving forward: $0.77, $0.70, $0.6098, $0.5919, $0.5274, $0.45.
- Resistance moving forward: $0.8524, $1.00, $1.04, $1.11, $1.21, $1.24, $1.43.
The cryptocurrency 0x has seen a 5% price rise over the last 24 hour trading session. 0x now trades at a price around $0.80, at the time of writing, after experiencing a 7-day price decline totaling 4.7%.
0x is presently ranked 25th in market cap rankings with a total market cap value of around $438 million after undergoing an impressive 31% price increase over the past 30 trading days. This puts 0x as the best performing cryptocurrency in the top 25 coins by market cap rankings.
The 15-month old cryptocurrency is now trading at a value that is 66% lower than its all-time high price.
Let us proceed to analyze price action for ZRX/USD over the long term and assess the market behavior.
0x Price Analysis
ZRX/USD – LONG TERM – DAILY CHART
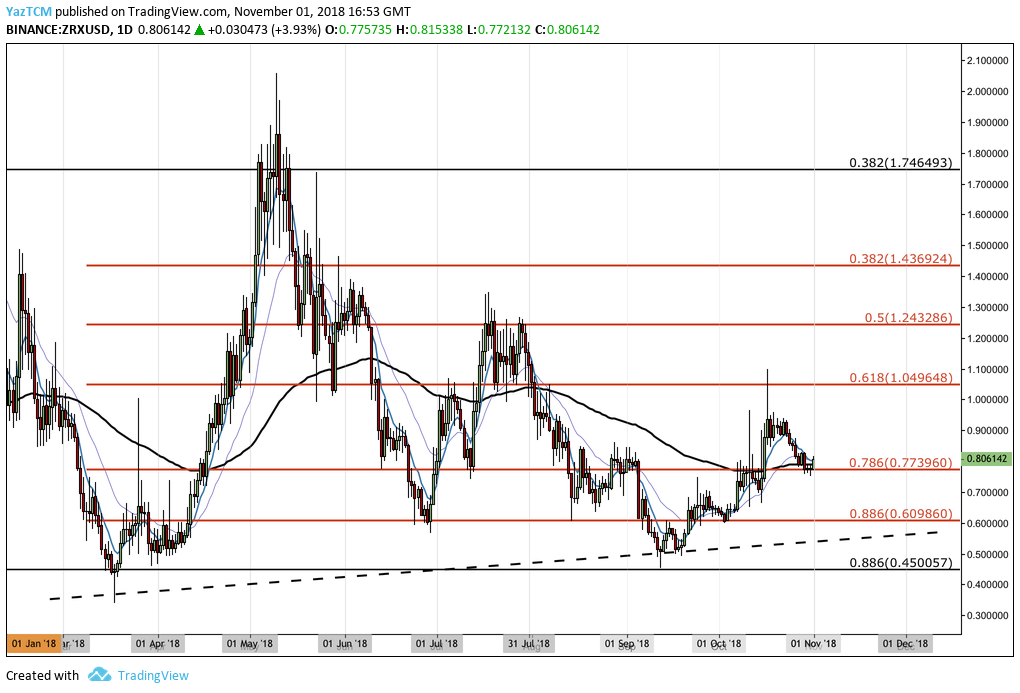
In the long-term outlook above, we can see that price action has seen a price surge which saw ZRX/USD start from a low of $0.3410 on March 18, 2018 and extend to a high of $2.0572 on May 10, 2018. This created a price increase totaling over 500% from low to high.
We can see that after reaching the high, the market reversed and began to decline until finding an area of strong support at the .886 Fibonacci Retracement level (drawn in red), priced at $0.6098 during June 2018. The market then rebounded from this area until meeting further resistance higher at the .5 Fibonacci Retracement level, priced at $1.2432 during July 2018.
Price action went onto decline further to meet support at the long-term .886 Fibonacci Retracement level (drawn in black) priced at $0.45 during September 2018. It is from this price level where the recent market rally has occurred over the past 2 trading months.
Let us take a closer look at this recent price ascension and highlight any potential support and resistance areas moving forward.
ZRX/USD – SHORT TERM – DAILY CHART
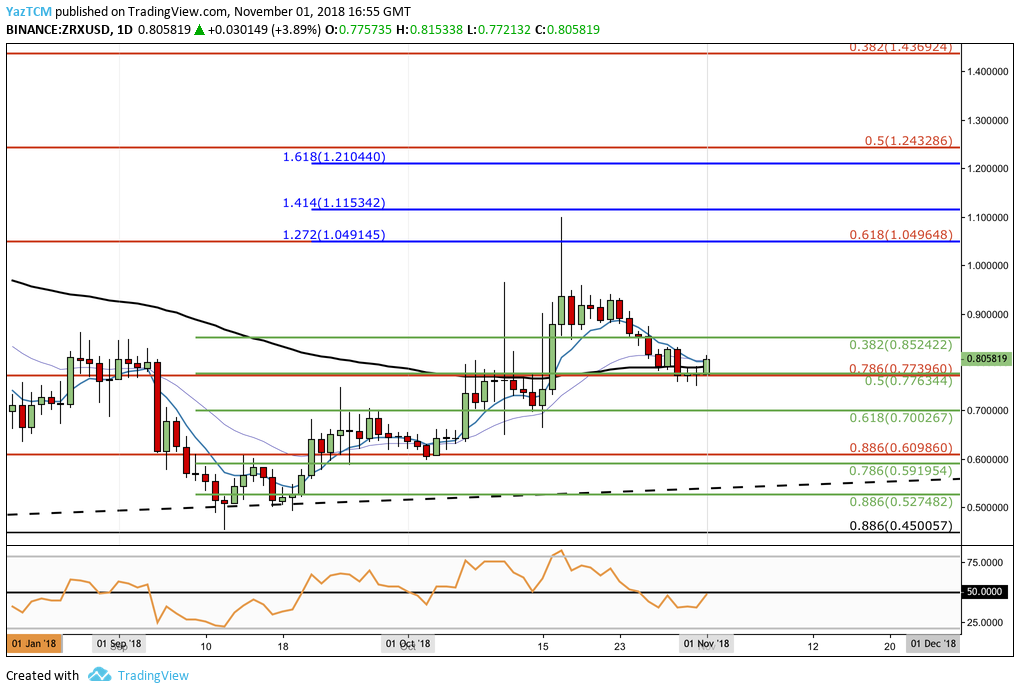
Inspecting ZRX/USD from the short-term perspective above, we can observe the market rally. It started from its low at $0.4530 on September 12, 2018 and then continued to rise to a high of $1.0989 on October 17, 2018. This was a price increase of145% from low to high.
We can see that ZRX/USD has retraced slightly and pulled back toward support at the short-term .5 Fibonacci Retracement level (drawn in green) priced at $0.7763.
This area of support is also further strengthened due to the long-term .786 Fibonacci Retracement level (drawn in red) also being closely located within this area. To add even further to the support, the 100-day moving average is also located within the price range.
Moving forward, in our bullish scenario, if the buyers continue with their recently established price hike, they will meet immediate resistance above at the short-term .382 Fibonacci Retracement level (drawn in green) priced at $0.8524. If the buyers can then continue to press ZRX/USD above the psychological round number handle at $1.00, further resistance above can be expected at the 1.272 Fibonacci Extension level (drawn in blue) priced at $1.0491.
This area of resistance is further bolstered by the long-term .618 Fibonacci Retracement level (drawn in red) which is priced at the same level.
Provided that the bullish action continues above $1.0491, more expected resistance above can be located at the 1.414 and 1.618 Fibonacci Extension levels (drawn in blue), priced at $1.1153 and $1.2104.
Alternatively, on the bearish side, if the sellers push the market beneath the identified support at the $0.77 handle, the buyers can expect further immediate support beneath at the short-term .618 Fibonacci Retracement level (drawn in green) priced at $0.70.
Further support located below the $0.70 handle can then be expected at the long-term .886 Fibonacci Retracement level (drawn in red) priced at $0.6098, followed by the short-term .786 Fibonacci Retracement level (drawn in green) priced at $0.5919.
If the bears continue to pressure the market further below the highlighted (dotted) rising support trend line, further support beneath can be expected at the short-term .886 Fibonacci Retracement level (drawn in green) priced at $0.5274.
The RSI technical indicator is currently trading along the 50 handle, indicating that the momentum is still to play for. If the RSI can break above the 50 handle, we could expect this market to continue to move higher.
Let us continue to quickly analyze price action for 0x relative to Bitcoin over the short term and highlight any areas of potential support and resistance moving forward.
ZRX/BTC – SHORT TERM – DAILY CHART
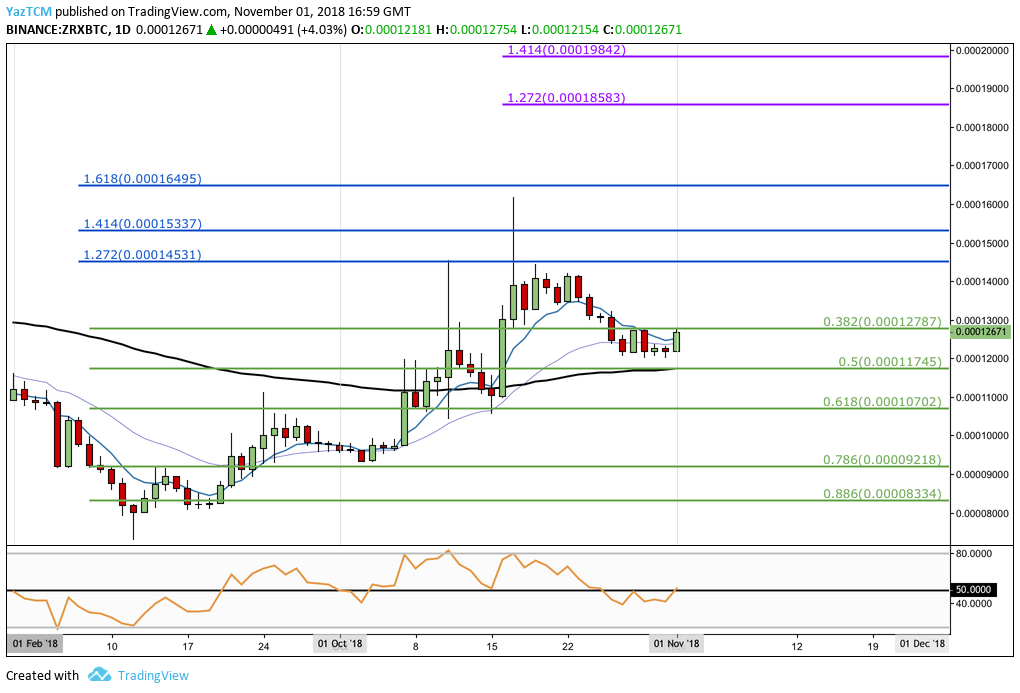
Taking a look at ZRX/BTC over the short term perspective above, we can immediately notice the bullish price run. It started at a low of 7,304 SATS on September 12, 2018 and continued to extend to a high of 16,176 SATS on October 17, 2018. This was a price increase totaling over 120%.
Price action has pulled back slightly from the high, and is now trading at resistance marginally below the .382 Fibonacci Retracement level priced at 12,787 SATS.
Looking ahead, in our bullish scenario, if the bulls can continue to press ZRX/BTC price action above 12,787 SATS, then they will immediately encounter resistance at the medium-term 1.272 and 1.414 Fibonacci Extension level (drawn in blue), priced at 14,531 SATS and 15,337 SATS respectively.
More resistance above is then set at the 1.618 Fibonacci Retracement level (drawn in blue again), priced at 16,495 SATS.
If the buyers continue to climb up above 16,495 SATS, higher resistance will be met at the short-term 1.272 and 1.414 Fibonacci Extension levels (drawn in purple), priced at 18,583 SATS and 19,842 SATS respectively.
The RSI within this market has recently just penetrated above the 50 handle which indicates that the buyers are beginning to grab a hold of the momentum within the market. If the RSI can continue to rise higher, we could see ZRX/BTC climb further higher.