Zilliqa has experienced a price surge over the past 24 hours totalling up to 6.20%. The cryptocurrency is currently trading hands at $0.075 at the time of writing, and has suffered an 11.35% drop over the past 7 trading days.
Zilliqa was founded by Xinshu Dong and intends to become a solution to the scaling problems presented by the top blockchain projects today. Zilliqa is described as the first high-throughput platform based on blockchain, that increases its throughput as the network expands. It is said to have a linear scaling trajectory.
The technology behind Zilliqa is known as sharding, the process of dividing the network into small groups which are each capable of processing parallel transactions. This allows the network to process a higher number of transactions at the same time without the risk of bottlenecking.
For an idea of the throughput capable by Zilliqa, during the testnet period, Zilliqa managed to record an impressive 2,488 transactions per second with only 3,600 nodes. For comparison, Ethereum can currently handle a small number of transactions per section in the region between 20-27. More so, Bitcoin can only currently handle a meager 7 transactions per second at this moment in time.
The 6-month old coin has risen to prominence surprisingly quickly. Zilliqa is ranked 24th in terms of overall market cap across the entire industry, with a total market cap value of $571 million. Zilliqa has experienced a price surge of 22% over the past 30 trading days.
Let us continue to analyze price action over the short life span of Zilliqa.
Price Analysis
ZIL/USD – SHORT TERM – DAILY CHART
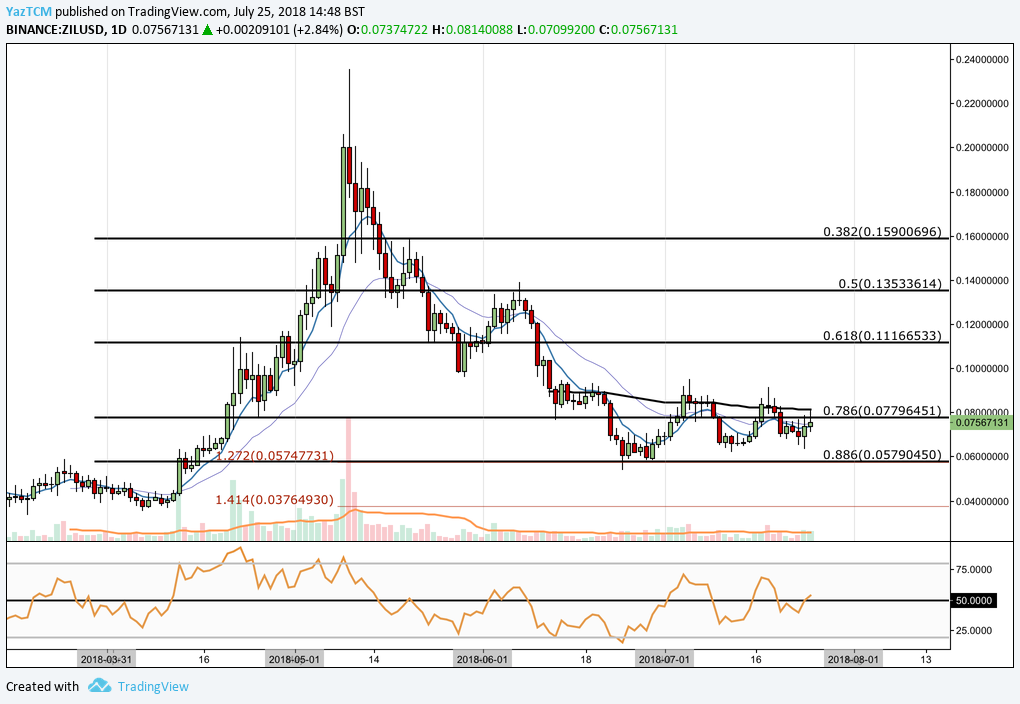
https://www.tradingview.com/x/F6A08nWq/
Analyzing the market from the short-term perspective above, we can see that Zilliqa had experienced a strong bullish run when price action started from a low $0.035 on April 6, 2018 and rose to an all-time high of $0.234 on May 10, 108. This was a price increase of over 570% from low to high.
Price action went on to fall after placing this all-time high, initially finding support at the .618 Fibonacci Retracement priced at $0.11. This is a Fibonacci Retracement measured from the bullish run aforementioned.
As June started trading, price action continued to fall further lower, falling through the .786 Fibonacci Retracement priced at $0.077 until it found support at the .886 Fibonacci Retracement priced at $0.057. We can see that price action had experienced significant support in this area as it rebounded. It is also important to mention that this area of support is bolstered by the downside 1.272 Fibonacci Extension level priced at $0.057, measured from the entire bearish fall witnessed in May.
Price action has been trading in a coiling narrow range during July as it currently trades at resistance marked by the .786 Fibonacci Retracement priced at $0.07 and the 100-day moving average. The market will need significant moment to overcome this level.
If the bullish pressure can push past this resistance level, we expect near-term support to be located at July’s highs at $0.095. Further resistance above this level is expected at $0.10 followed by the .618 Fibonacci Retracement priced at $0.11.
Alternatively, if price action is overpowered by the resistance at the .786 Fibonacci Retracement, we expect near-term support to be immediately located at the .886 Fibonacci Retracement level priced at $0.057. Support expected below this level is at the downside 1.414 Fibonacci Extension level priced at $0.037.
The RSI indicator is currently producing a neutral signal at this moment in time as the RSI is currently trading only slightly above the 50 handle. If we are to expect a bullish run within this market, we would need to see the RSI stay above the 50 handle and slowly rise over time.
Similarly, the moving averages are producing neutral readings at this moment in time. However, the moving averages are poised for a bullish crossover which would result in a bullish run within the market. If the 7-day EMA (blue moving average) can cross up above the 21-day EMA (purple moving average) this would constitute a bullish crossover indicating that the bullish pressure is building within the market.
Let us continue to analyze Zilliqa price action relative to Bitcoin over the same period.
ZIL/BTC – SHORT TERM – DAILY CHART
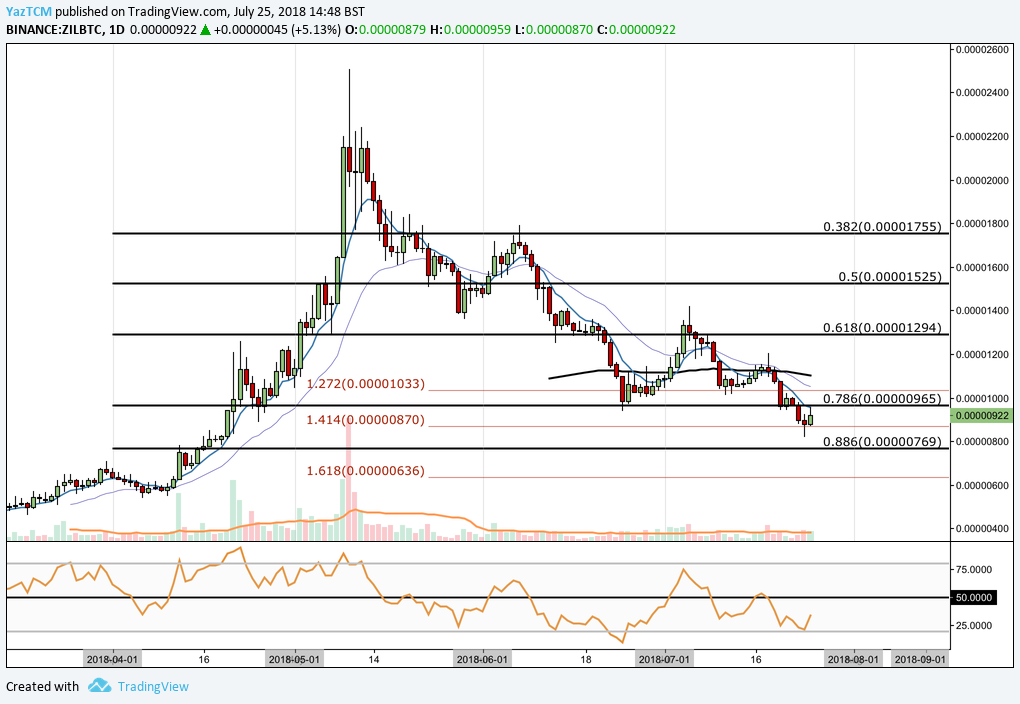
https://www.tradingview.com/x/QNfEE9H3/
Analyzing the market relative to Bitcoin, we can see that the ZIL had experienced a bullish run when price action started from a low of 541 SATS on April 6, 2018 and rose to an all-time high of 2,508 SATS on May 10, 2018. This was a price increase of over 350% from low to high.
The market went on to fall after placing the all-time high, until it found support at the .786 Fibonacci Retracement priced at 965 SATS towards the end of June. This is a Fibonacci Retracement measured from the entire bullish run outlined above. The downside 1.272 Fibonacci Extension priced at 1,033 SATS had also provided some support in this same price area.
As July began trading, the market made a small rally into the .618 Fibonacci Retracement priced at 1,294 SATS but was strongly rejected by this area. As a result, the market declined and fell below the previous support at the .786 Fibonacci Retracement until it found support located at the downside Fibonacci Extension priced at 870 SATS.
The market is currently trading at resistance located at the .786 Fibonacci Retracement level priced at 965 SATS. If the market can push up above this level, we expect near-term resistance to be located at the 100-day moving average which is currently hovering around the 1,100 SATS level. Further resistance above this level is expected at the .618 Fibonacci Retracement priced at 1,294 SATS.
The technical indicators within this market are heavily favoring the bears at this moment in time. The RSI is currently trading well below the 50 handle, near oversold conditions, indicating that bearish momentum is predominantly in control. If we are to expect a recovery rally, we would need to see the RSI make its way toward the 50 handle and eventually break up above it.
Similarly, the moving averages are pointing in an extremely bearish manner with the 7-day EMA far below the 21-day EMA indicating that the bearish pressure is increasing. If we want to see this bearish pressure begin to ease up, we will like to see the 7-day EMA make its way back toward the 21-day EMA and eventually cross up above it.
Conclusion
Scalability is the hotly debated product that is front and center currently within the crypto universe. Scalability issues that are currently plaguing Ethereum and Bitcoin are currently holding back the growth and adoption of the network.
The high level of throughput available on the Zilliqa network, with the ability to infinity scale, provides a very strong solution to the problems that other blockchains are currently facing.
We will be closely following updates from the Zilliqa team as the market looks forward to the mainnet launch expected at some time during Q3 2018.