Zcash has experienced a slight price hike totaling 2.52% over the past 24 hours of trading. The privacy-focused cryptocurrency is currently exchanging hands at $181.91, and has suffered a steep price drop of 14% over the past 7 trading days.
Zcash is described as a cryptocurrency that provides strong privacy protection. It achieves this privacy feature by implementing a zero knowledge protocol of proof known as ZK-SNARKS.
Typically on a blockchain, all the transactions are publicly made available and anyone can view each and every individual transaction including information regarding the sender, receiver and transfer amount. ZK-SNARKS works by hiding the identity of the sender and receiver as well as the transaction value on the blockchain. These private transactions are known as shielded transactions.
For more information regarding Zcash we recommend reading “What the Future Holds for Zcash: Can It Win the Battle of the Privacy Coins?“
Zcash was released in October 2016 by Zooko Wilcox, the CEO and founder. Since its launch, it has gained an overwhelming level of traction and support. However, there are others, such as Bitcoin developer Peter Todd, who are concerned with the level of privacy of ZK-SNARKS due to it being “experimental.”
Coinbase has also recently announced a list of coins that they are considering adding to Coinbase Custody, and Zcash is amongst the list. However, it is important to note that Coinbase Custody is for coin storage only and these coins are not being added to the Coinbase exchange just yet.
ZCash is currently ranked 19th in terms of overall market cap across the entire industry, with a total market cap value of $821 million.
Let us continue to analyze price action for Zcash over the long term.
Price Analysis
ZEC/USD – LONG TERM – DAILY CHART
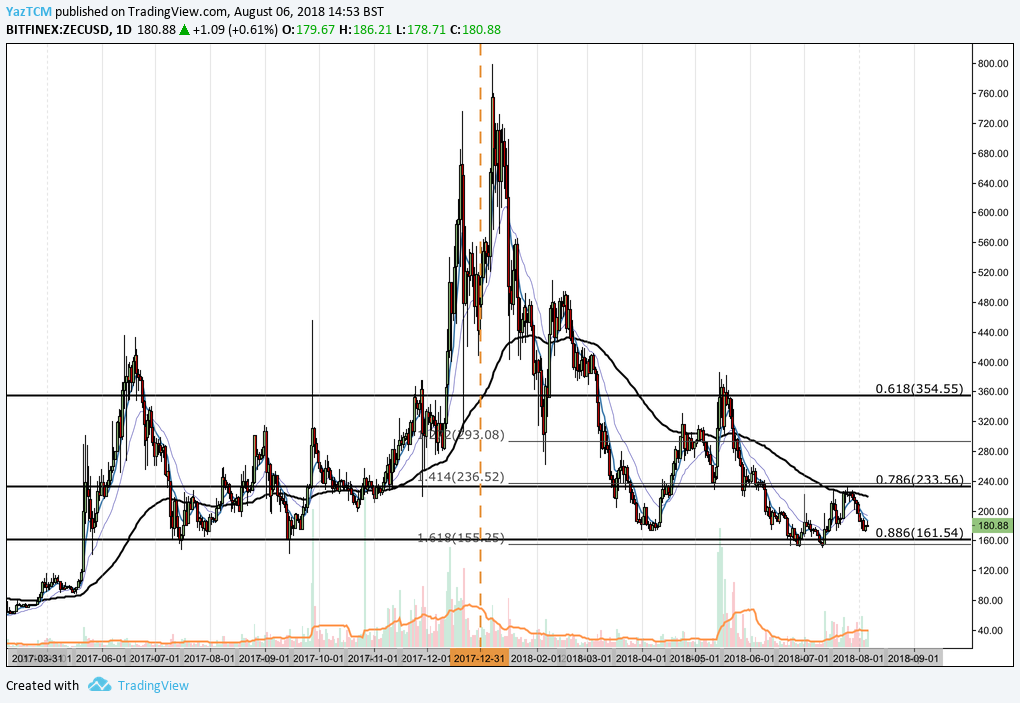
Analyzing the market from the long-term perspective above, we can see that Zcash had experienced a great bull run during 2017. Price action started from a low of $74.45 on April 26, 2017 and continued to an all-time high of $799.26 on January 7, 2018. This resulted in a 785% price increase from low to high.
We can see that the market went on to depreciate after placing the all-time high, initially finding support at a downside 1.272 Fibonacci Extension priced at $293 in February 2018. The market continued to decline further throughout the year until it reached support denoted by the .886 Fibonacci Retracement, priced at $161.54 toward the end of June.
This Fibonacci Retracement is measured from the entire bullish run outlined above. This area of support was also significantly bolstered by the long-term downside 1.618 Fibonacci Extension priced in the same area.
Let us continue to analyze price action a little closer over the shorter time period to highlight any potential support and resistance zones.
ZEC/USD – SHORT TERM – DAILY CHART
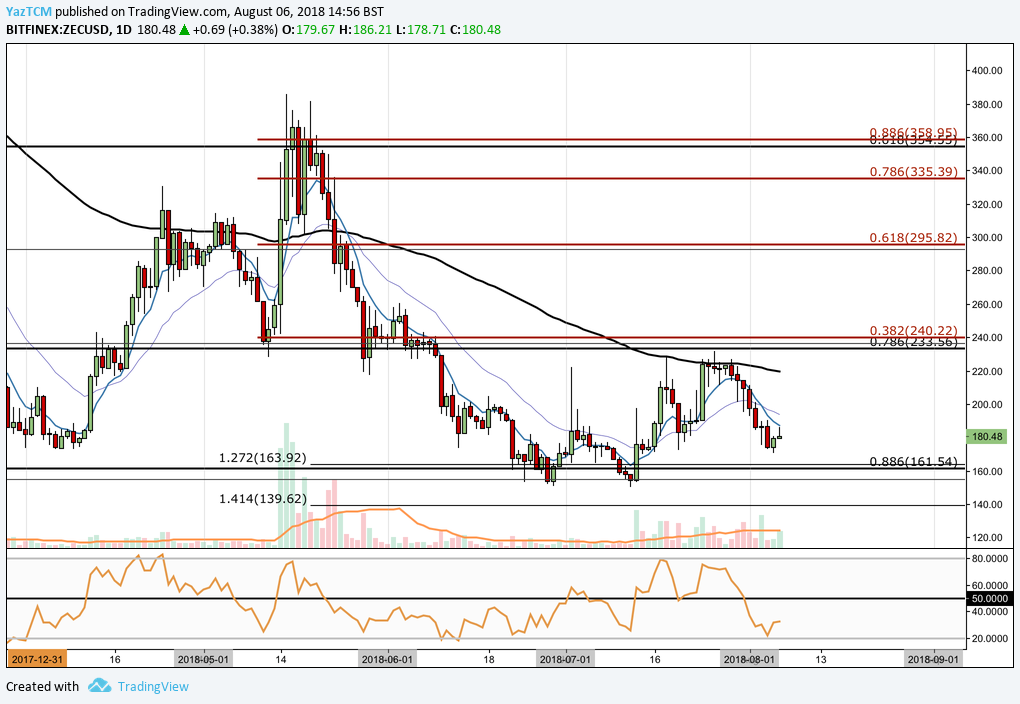
Analyzing the market from a shorter perspective, we can see that price action underwent a smaller price run during April when the market started at a low of $172.51 on April 7, 2018 and extended to an intermediate high price of $385 on May 15, 2018. This was a price increase totaling 120% from low to high.
The market could not sustain this bullish momentum, and went on to retrace as price action dropped below the 100-day moving average. We can see that the market continued to fall, until it hit support at the the long-term .886 Fibonacci Retracement priced at $161.54. The area of support was also further reinforced by another short-term downside 1.272 Fibonacci Extension, priced at $163.92 (separate from the Fibonacci Extension aforementioned).
The market rebounded at this support and went on to begin a small bullish rally in July. The rally was heavily defended by the bears as price action approached the 100-day moving average. The bears momentum at this level far outweighed the bulls, and the market began to decline once more.
If the bearish momentum continues within the market, we expect the nearest level of significant support to be located at the long-term .886 Fibonacci Retracement priced at $161.54. The bears will need a lot of momentum to break below this level but if they do, further support is expected at the short-term downside 1.414 Fibonacci Extension priced at $139.62.
Alternatively, if the bulls can garner momentum once again and push price action back upwards, we expect immediate resistance to, once again, be located at the 100-day moving average. Resistance above this level is expected at the bearish .382 Fibonacci Retracement priced at $240.22.
The technical indicators are currently favoring the bears at this moment in time. The RSI is trading well below the 50 handle at oversold conditions near the 20 level. If the market is to be expecting another bullish wave, we will need to see the RSI make its way back toward the 50 handle and continue further higher.
Similarly, the moving averages are printing readings that favor the bears. The 7-day EMA (blue moving average) had recently crossed below the 21-day EMA (purple moving average), indicating that the bearish pressure is fully in control. If we are to expect a sustained price rally, we will need to see the 7-day EMA cross back above the 21-day EMA for a bullish crossover signal.
Let us continue to analyze price action relative to Bitcoin over the long term.
ZEC/BTC – LONG TERM – DAILY CHART
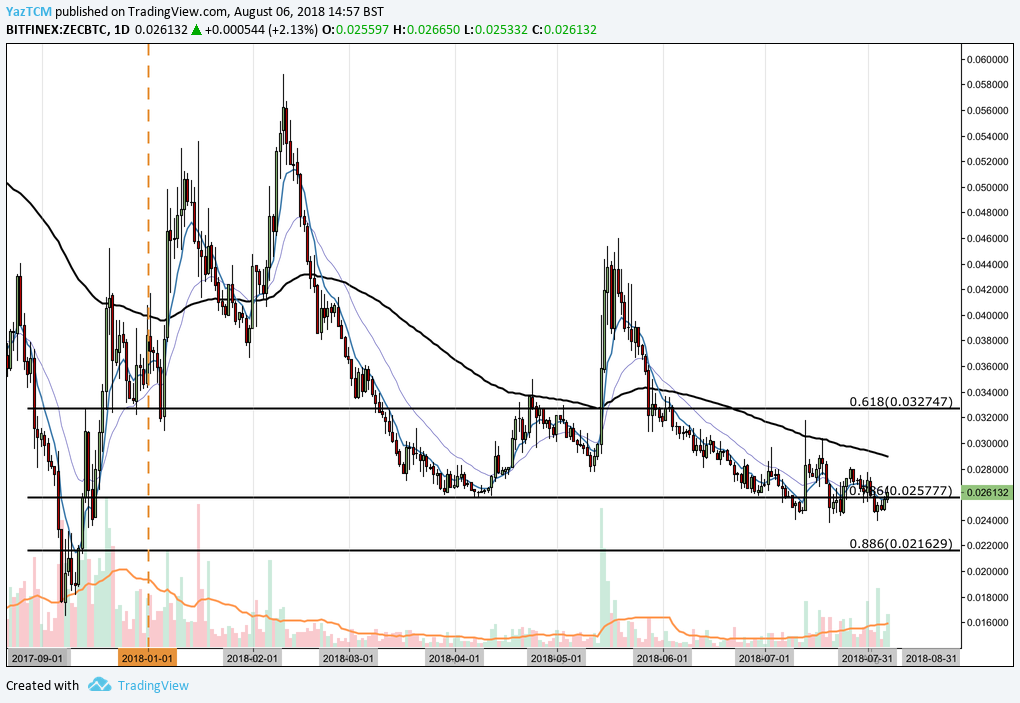
Analyzing the market relative to Bitcoin, we can see that Zcash had experienced a price rally totaling 255% toward the end of 2017, as price action started from a low of 0.01650 on December 8, 2017 and extended to a high of 0.058793 on February 10, 2018.
We can see that the market went on to decline through the end of February, and continued to decline until finding support at the .786 Fibonacci Retracement priced at 0.02577 in March. This Fibonacci Retracement is measured from the entire bullish run outlined above.
Let us continue to analyze price action a little closer to highlight any potential support and resistance zones.
ZEC/BTC – SHORT TERM – DAILY CHART
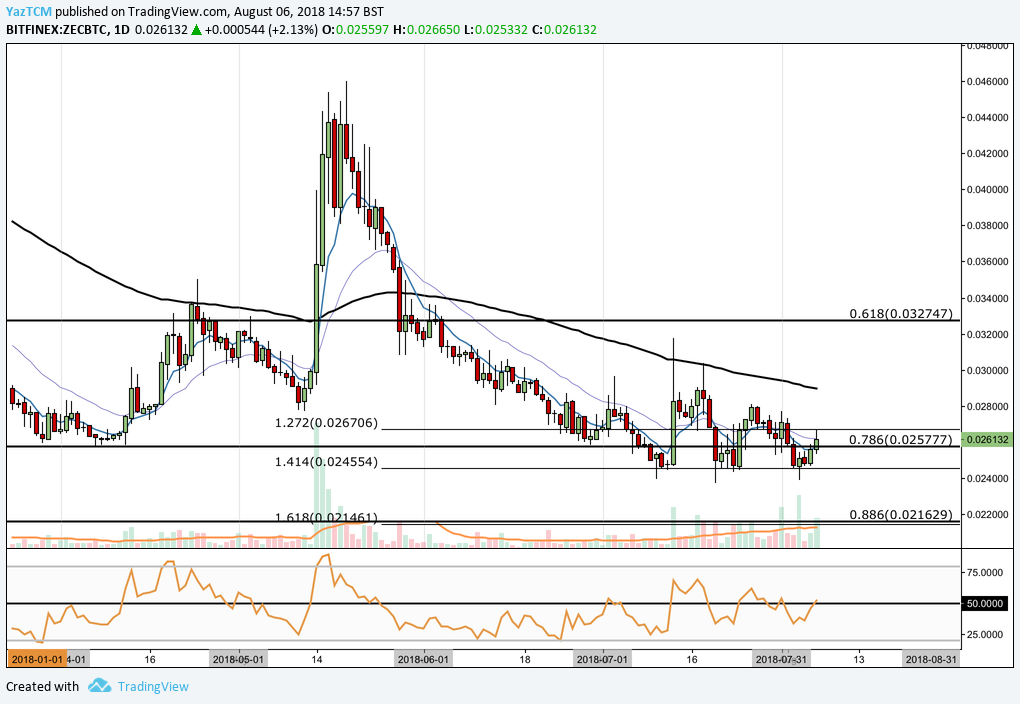
Analyzing the market from a shorter perspective, we can see that price action had experienced another bullish run in April as the market started from a low of 0.025801 on April 5, 2018 and continued to a high of 0.046 on May 19, 2018. This was a price increase totaling 78% from low to high.
We can see that toward the end of May, the market dipped below the 100-day moving average and continued to fall until finding support at a short-term downside 1.414 Fibonacci Extension priced at 0.024554 during July. This price level continued to be a pivotal area of support during July and early August.
We can see that the market is currently trading at resistance marked by the short-term downside 1.272 Fibonacci Extension priced at 0.0267. If the bulls can push price action above this level, we expect immediate resistance to be located at the 100-day moving average which is currently hovering around 0.0290. Further resistance above this level is located at the long-term .618 Fibonacci Retracement level priced at 0.0327.
Alternatively, if the bears step back into the market over the next week and push the market below the downside 1.414 Fibonacci Extension support level priced at 0.024554, we expect immediate support to be located at the long-term .886 Fibonacci Retracement level priced at 0.021629. This area of support will be bolstered by the short-term downside 1.618 Fibonacci Extension level priced in the same area.
The RSI indicator is currently trading at the 50 handle indicating the indecision within the market. For a price rally, we would like to see the RSI break above the 50 handle and continue to slowly rise over time.