
- Stellar has remained relatively strong amidst the market bloodbath recently witnessed.
- The market is still trading within the range of its sideways consolidation pattern as the market trends towards support around $0.20.
- Support below: $0.2092, $0.20, $0.1898, $0.18, $0.1752.
- Resistance above: $0.2418, $0.2648, $0.2877, $0.30, $0.3160, $0.3760, $0.3911.
Stellar Lumens has seen a pretty steep 12.90% drop over the past 24 hours of trading (at the time of writing) as the entire cryptocurrency markets slump across the board. Stellar is presently trading around the $0.2318 handle, and XLM has seen a 5% decline against BTC over the past 24 hours.
The Lumens project is now ranked in 5th position in terms of overall market cap value with a total market cap of $4.39 billion. Despite the recent price decline, XLM holders may find comfort in the fact that XLM has seen a 90-day period where price action has increased by over 12%.
The 51-month old coin is now trading at a price that is 72% lower than its all-time high value.
Let us continue to analyze price action for XLM/USD over the long term.
Stellar Price Analysis
XLM/USD – LONG TERM – DAILY CHART
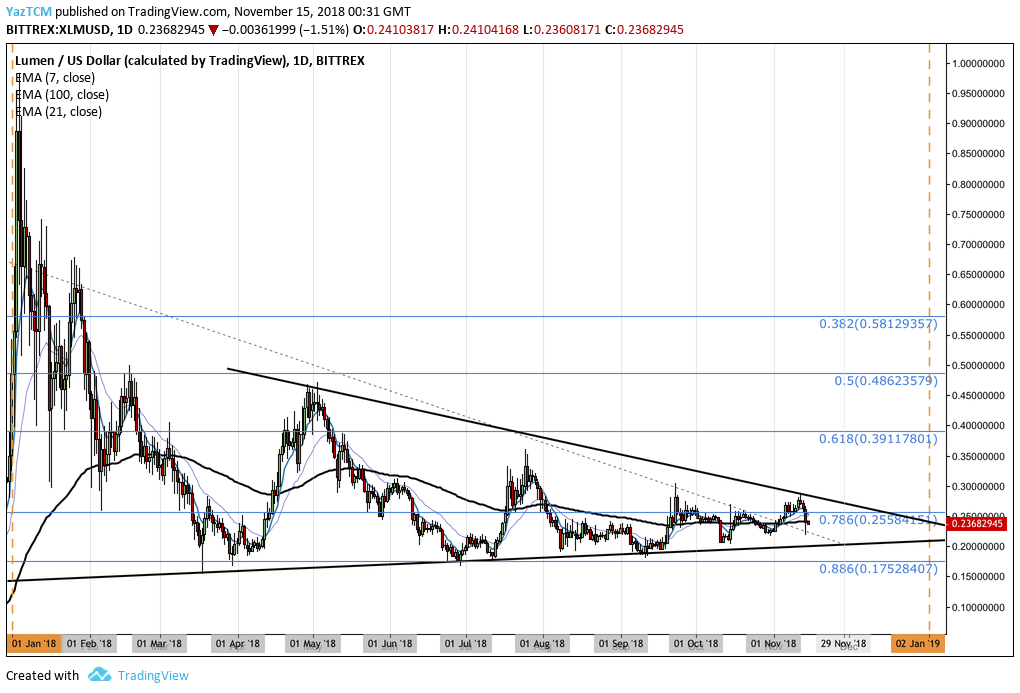
Analyzing price action from the long-term perspective above, we can see that the market has broken out above the previous symmetrical triangle boundary that we had outlined in our previous XLM article. The now-broken triangle boundary is represented by a dotted line.
We can see that the market has now established a new, shorter-term, symmetrical triangle pattern as the market currently rests near the 100-day moving average.
Let us continue to analyze price action a little closer over the short term and highlight any potential support and resistance areas moving forward.
XLM/USD – SHORT TERM – DAILY CHART
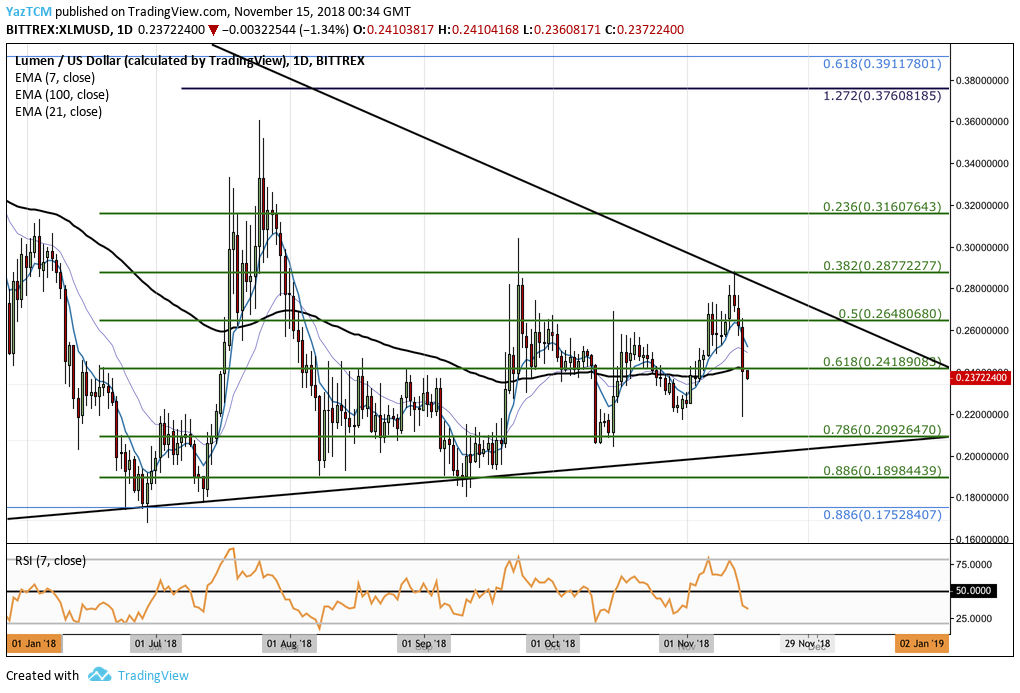
Examining XLM/USD from the benefit of a closer time horizon, we can see that price action still remains within the range of the previous bullish swing leg which began from a low of $0.1676 on June 29, 2018 and surged to $0.3606, a price 114% higher, on July 25, 2018.
During November 2018 we can see that XLM/USD began to rally until meeting resistance at the short-term .382 Fibonacci Retracement level priced at $0.2877 before rolling over. This area of resistance was also bolstered by the upper boundary of the new triangle formed.
In the market bloodbath seen on November 14, 2018, we can see that XLM/USD had slipped to a low of $0.02186 before recovering and closing at support provided by the .618 Fibonacci Retracement level, priced at $0.2418. At the time of writing, the market has slipped back slightly below this support area.
Moving forward, if the bearish presence looming over the overall industry increases and pushes XLM/USD lower, we can expect immediate support below to be located at the .786 Fibonacci Retracement level priced at $0.2092. Support below this can then be located at the lower boundary of the symmetrical triangle.
If the sellers continue to push XLM/USD below the lower boundary of the triangle, we can then expect further support to be located at the short-term .886 Fibonacci Retracement level (drawn in green) priced at $0.1894, followed then by the longer-term .886 FIbonacci Retracement level (drawn in blue) priced at $0.1752.
Alternatively, in our bullish scenario, if the buyers can resist the bearish sentiment and drive price action above the $0.2418 handle again, we can expect immediate resistance above to be located at the .5 Fibonacci Retracement level priced at $0.2648. Further resistance above this will be located at the upper boundary of the newly-formed symmetrical triangle.
If the bulls can continue above the triangle pattern, we can expect higher resistance to be located at the .382 and .236 FIbonacci Retracement levels, priced at $0.2877 and $0.3160 respectively.
If the bullish momentum can persist to push XLM/USD above the July 2018 high priced at $0.3606, then we can expect further higher resistance to be located at the 1.272 Fibonacci Extension level priced at $0.3760, followed by the long-term .618 FIbonacci Retracement level (drawn in blue) priced at $0.3911.
The RSI has recently dipped below the 50 handle to indicate the sellers have taken over this market. For an indication that the bearish momentum is fading, we will look for the RSI to rise and head back toward the 50 handle.
Let us continue to analyze XLM/BTC over the long term and assess market behavior.
XLM/BTC – LONG TERM – DAILY CHART
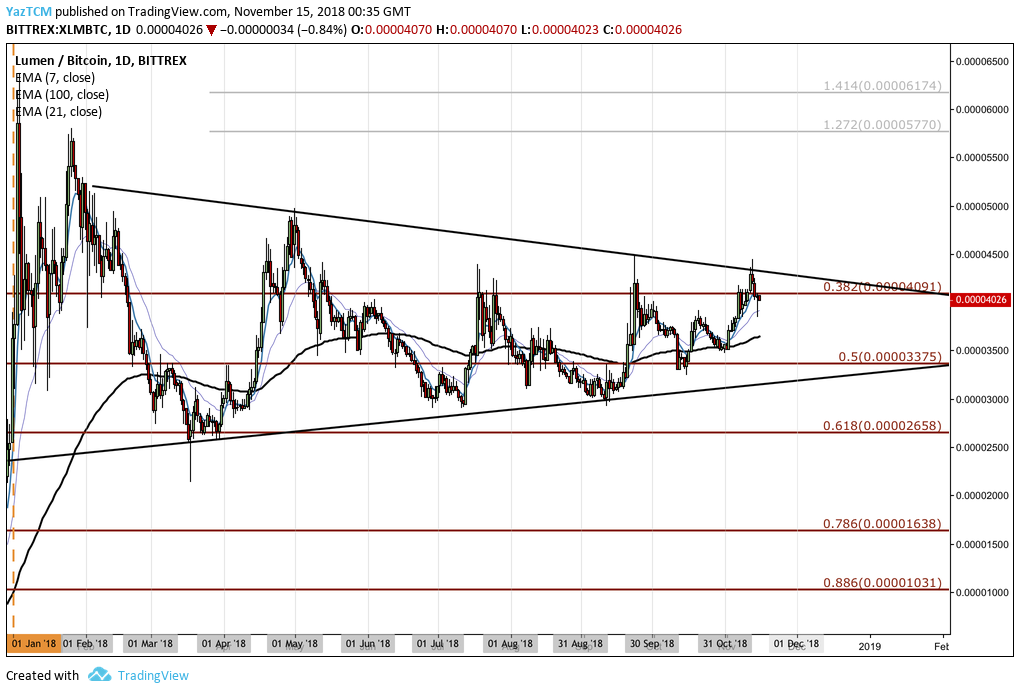
XLM/BTC over the long term has, largely, continued to trade sideways within a consolidation pattern bound by the long-term symmetrical triangle. The market is presently trading just below support provided by the long-term .382 Fibonacci Retracement level priced at 4,091 SATS.
Let us continue to analyze price action a little closer and highlight any areas of potential support and resistance.
XLM/BTC – SHORT TERM – DAILY CHART
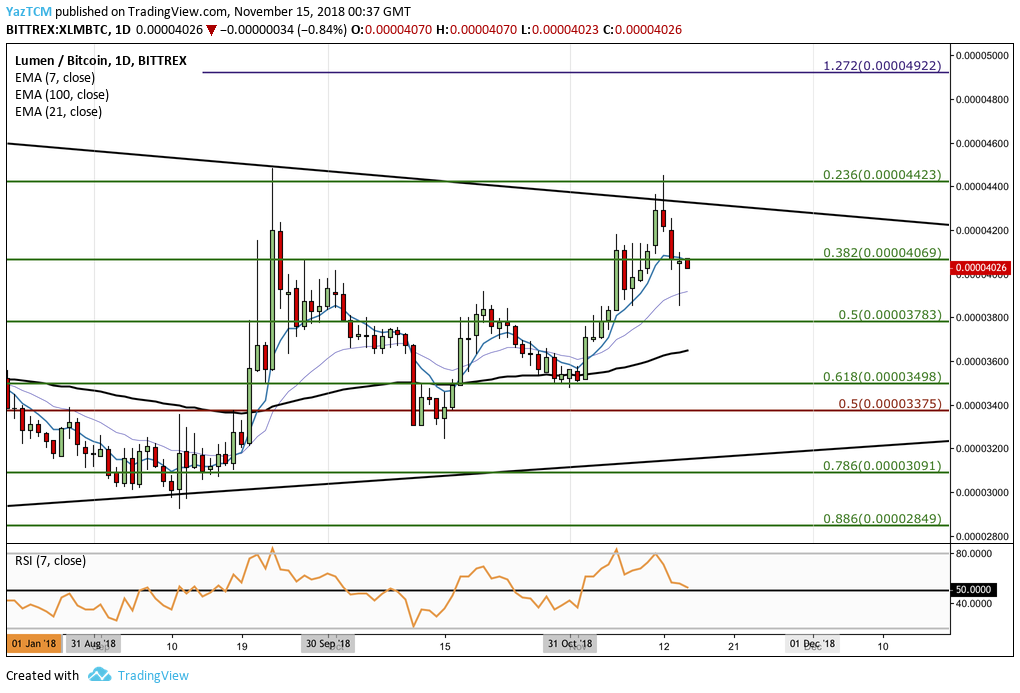
Taking a closer look at the market from a short-term perspective, we can see that XLM/BTC had experienced a bullish surge at the start of November 2018.
Price continued to rise until it reached the combined resistance provided by the .236 Fibonacci Retracement level priced at 4,423 SATS and the upper boundary of the symmetrical triangle.
The market has retraced slightly and is currently trading below support provided by the .382 Fibonacci Retracement level priced at 4,069 SATS.
Moving forward, if the sellers continue to drive price action lower, we can expect immediate support below to be located at the .5 FIbonacci Retracement level priced at 3,783 SATS. Support further below this can then be expected at the 100-day moving average which is currently hovering around the 3,651 SATS handle.
If the bearish pressure persists to push price action below the 100-day moving average, further support below can be located at the .618 Fibonacci Retracement level priced at 3,498 SATS, followed by the lower boundary of the symmetrical triangle.
If sellers continue to drive XLM/BTC further below the triangle, then more support can be expected at the .786 and .886 Fibonacci Retracement levels, priced at 3,091 SATS and 2,849 SATS respectively.
On the other hand, in our bullish scenario, if the buyers can drive price action higher above the 4,069 SATS handle once again, we can expect immediate resistance above to be located at the upper boundary of the symmetrical triangle pattern. If the bulls can climb above the triangle, higher resistance can then be located at the .236 Fibonacci Retracement level priced at 4,423 SATS.
If the bullish momentum can persist to push XLM/BTC further higher, more resistance above can be located at the 1.272 FIbonacci Extension level (drawn in purple) priced at 4,922 SATS.